PREFACE: FLASH FLOODING
(source: weather.gov)
What is flash flooding? It is flooding that begins less than 6 hours, often within 3 hours, and sometimes within minutes of excessive rainfall or a rapid release of water such as a dam or levee break.
Several factors contribute to flash flooding. The two key elements are rainfall intensity and duration. Intensity is the rate of rainfall, and duration is how long the rain lasts. Topography, soil conditions, and ground cover also play important roles.
Most flash flooding is caused by slow-moving thunderstorms, thunderstorms repeatedly moving over the same area, or heavy rains from hurricanes and tropical storms.
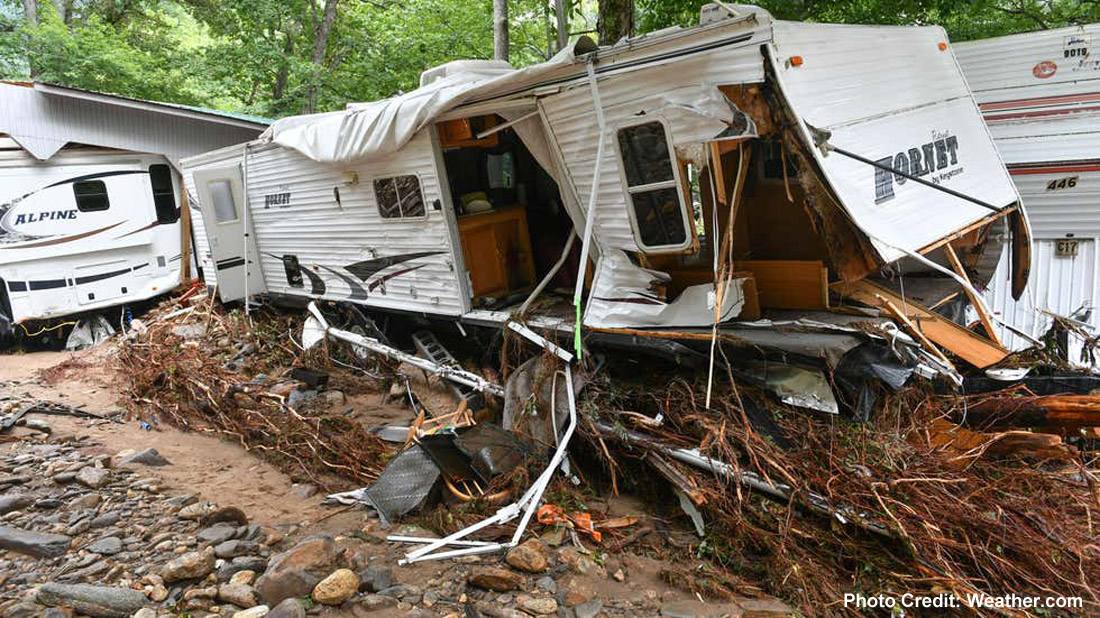
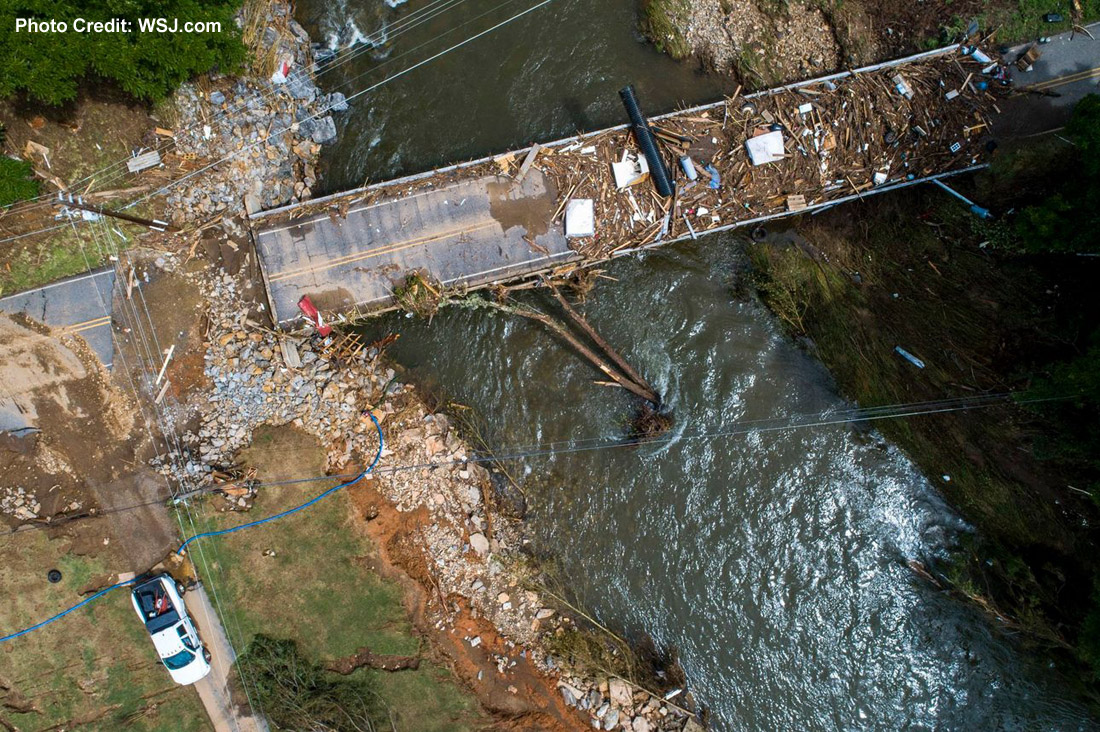
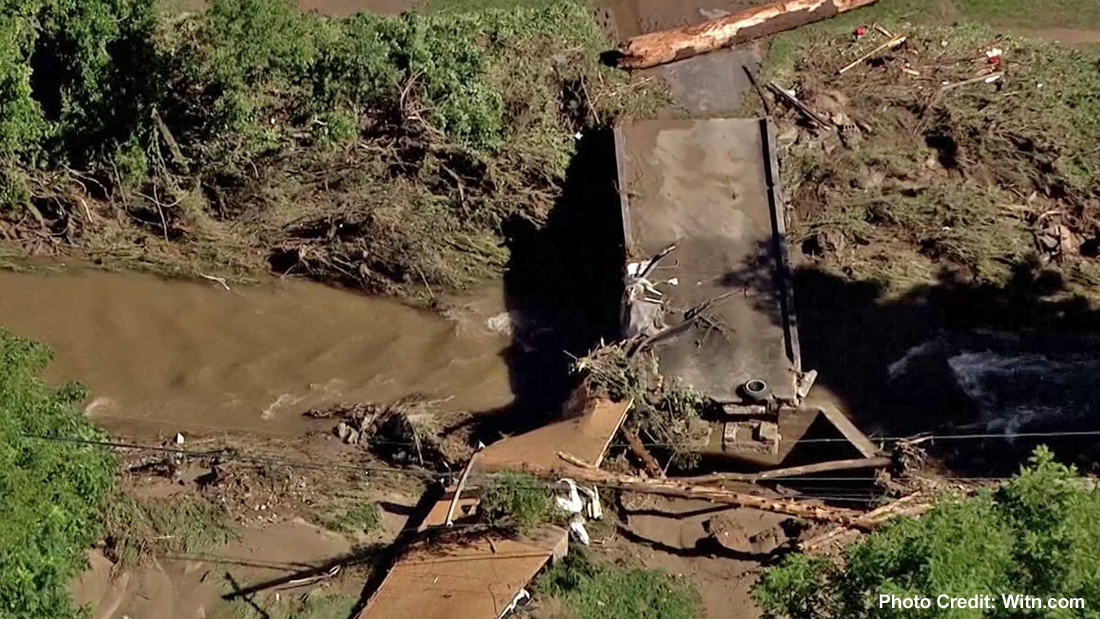
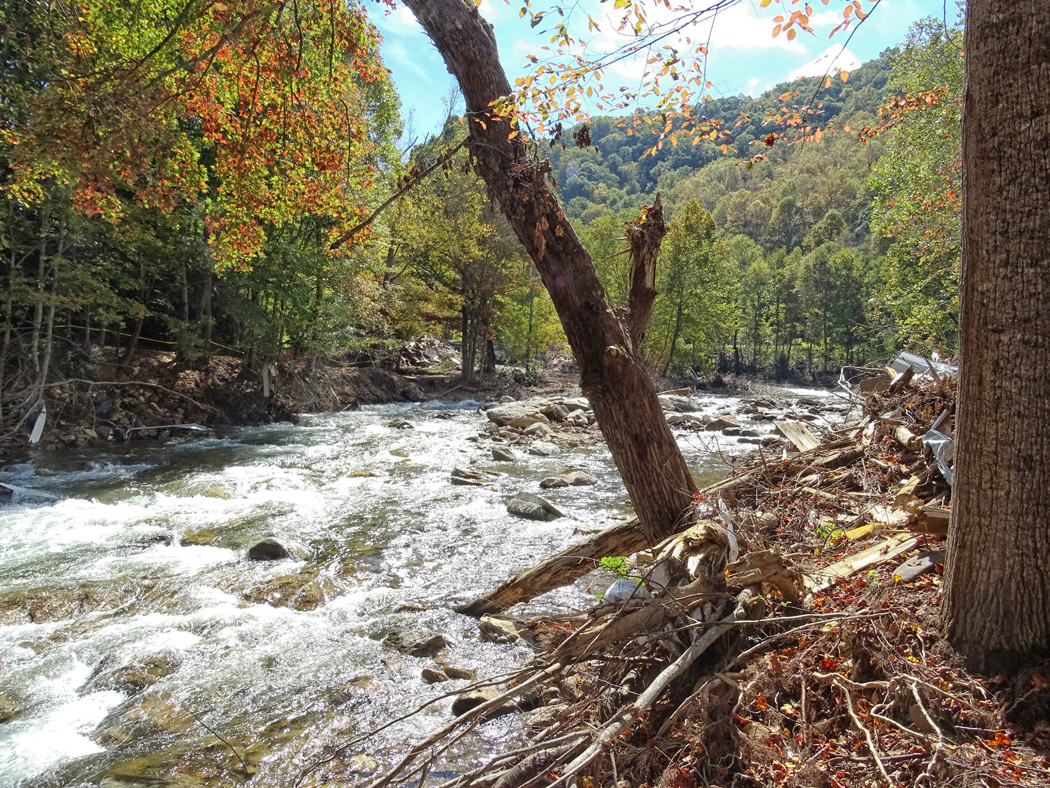
Flash floods can roll boulders, tear out trees, destroy buildings and bridges, and scour out new channels. Rapidly rising water can reach heights of 30 feet or more.
Flash flood-producing rains can trigger catastrophic landslides and debris flows.
Flash floods can undermine the base of slopes, roads and building foundations causing landslides and collapse.
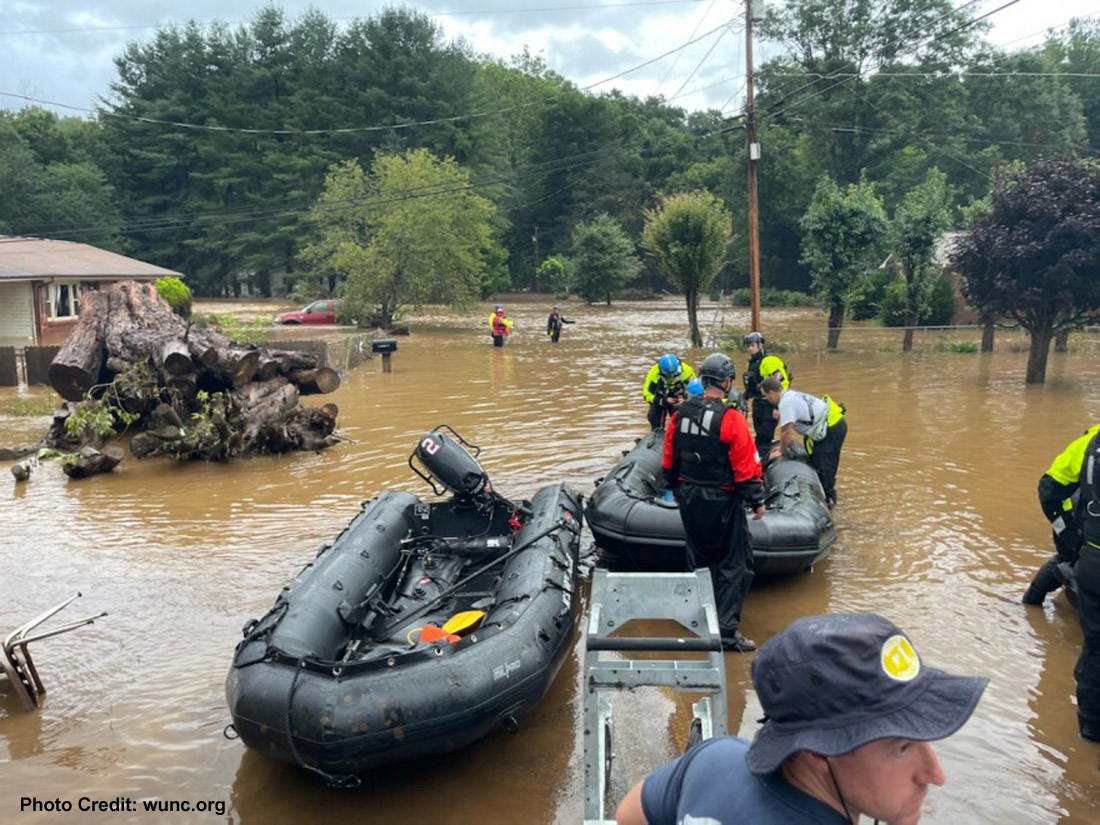
Flash floods can be deadly as they can occur quickly, without warning, and when people are caught off-guard; they are responsible for the most flood deaths.
Flash floods are a type of riverine flood. Narrow, steep valleys quickly collect water in a concentrated area making floodwaters move faster for a shorter duration. Rainfall with sufficient intensity and duration on the right topography can cause flash floods in a very short period. These floods are distinguished by their quick rise and intense, destructive flow. It is not unusual for a flash flood to have a channel velocity of about 6.1 miles per hour. At that speed, flash floodwaters can move a 90-pound rock downstream. In 1976, Colorado's Big Thompson Canyon experienced a flash flood with a channel velocity of 20.5 miles per hour. At that speed, the floodwater moved 250-ton boulders (FEMA, 2006). The density of floodwater makes it exceptionally destructive. Several inches of swift moving water can easily pick up and move vehicles or quickly destroy a home. Water moving at 10 miles per hour exerts the same pressure on a building as a 270-mile-per-hour blast of wind. This equals the windspeed of a devastating tornado that can level a well-constructed house. (Source: Floods can cause damage to structure, Shell, USA Today, September 9, 2005, page 3B)
One of the deadliest flash floods in Ohio occurred in the steep Appalachian valleys of Belmont County late on Thursday, June 14, 1990. The lives of 26 people were lost in this brief flash flood on Wegee Creek and Pipe Creek near Shadyside. Soils were saturated with water from a very wet month of May and tropical air was flowing northward from the Gulf of Mexico early on the 14th. Rainfall of 5.5 inches, with 3 to 4 inches in an hour, fell onto the steep-sided valleys and saturated soils along Pipe and Wegee Creeks. Nearly all the water ran off the slopes directly into the creeks, creating a wall of water over six feet high that moved down the creeks. Trees, cars, and collapsed buildings carried in the flow created debris dams at bridges along the creeks, causing higher flood levels and greater flows as the dams broke. Houses and mobile homes were pushed off their foundations and collapsed in the turbulent waters. About 80 homes were destroyed in the flood and another 250 damaged. Debris continued downstream into the Ohio River and was carried 30 miles to the Hannibal Dam, where it formed a raft of 15 acres. Refrigerators, furniture, toys, tires, dead livestock, and portions of homes mixed with hundreds of trees in the debris. Most of the 26 bodies were found downstream in the Ohio River, washed out of Pipe and Wegee Creeks by the flood.
(Source: Schmidlin, Thomas W. and Schmidlin, Jeanne A. Thunder in the Heartland: A Chronicle of Outstanding Weather Events in Ohio. Kent, Ohio: Kent State University Press, 1996)
A flash flood occurred in September 1992, near Cherokee, North Carolina. Light rainfall in the immediate area provided no indication of what was to suddenly occur. Runoff from a storm in the adjacent Great Smoky Mountain National Park roared down Raven Fork. Several thousand inhabitants in campgrounds along the stream were evacuated just before the flood arrived. Miraculously, no lives were lost. The crest of the flood was measured at ten feet above the calculated 100-year flood for this area. (source FEMA.gov)
|
|
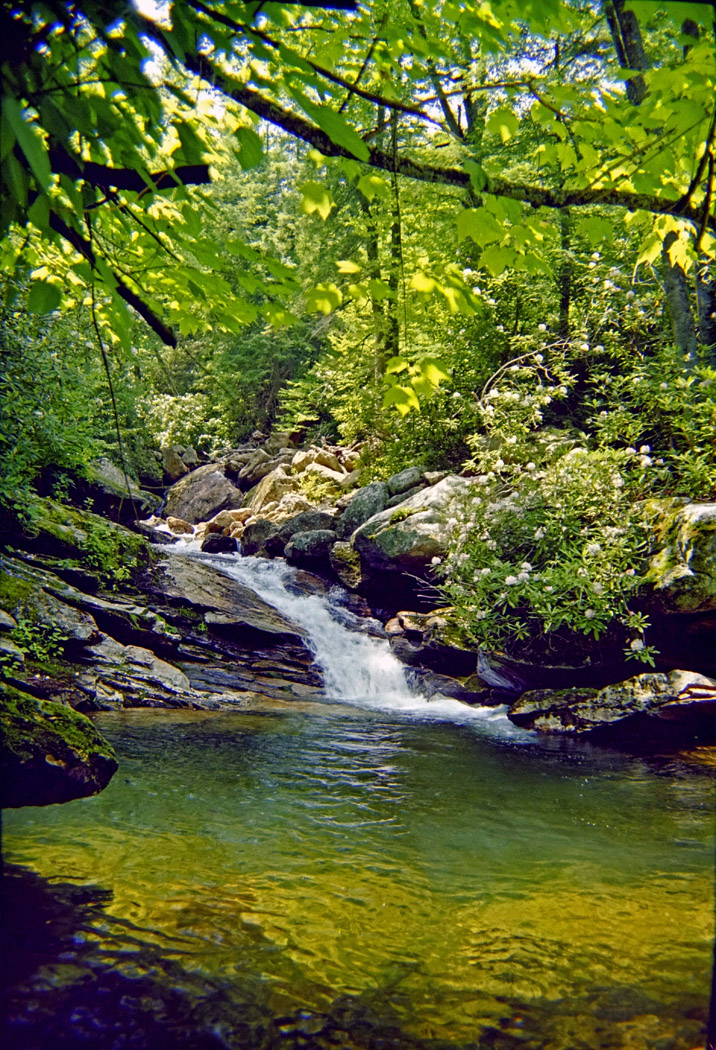
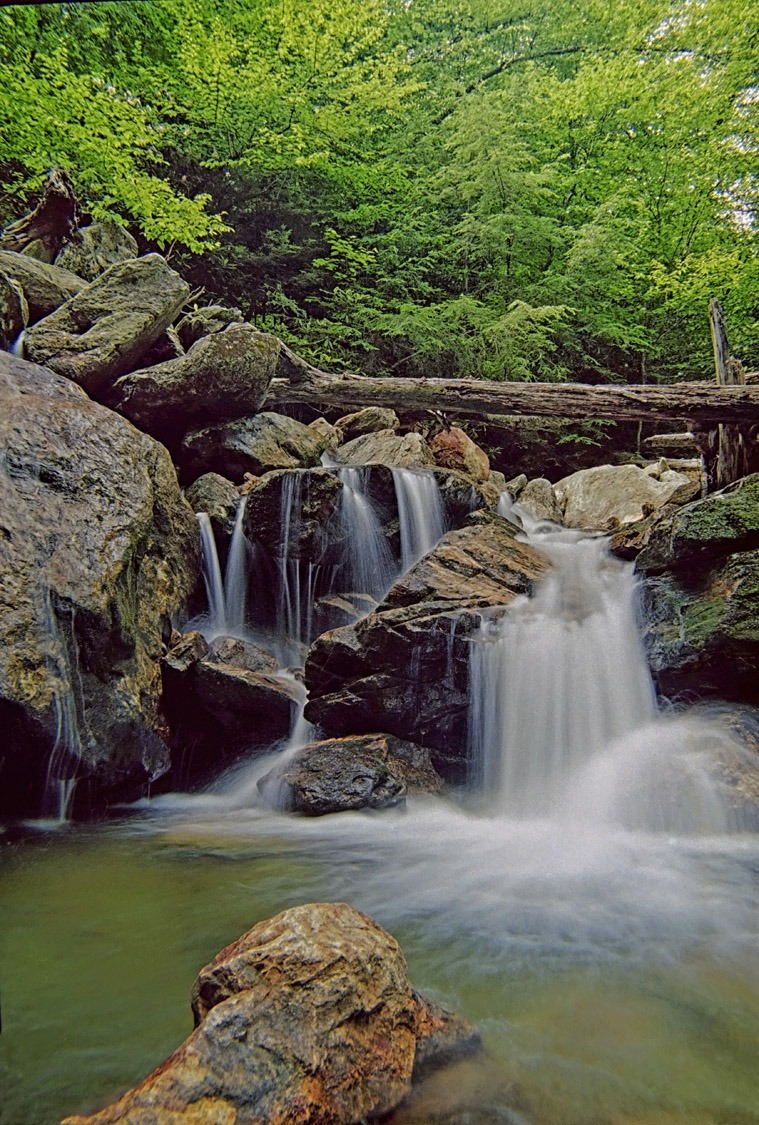
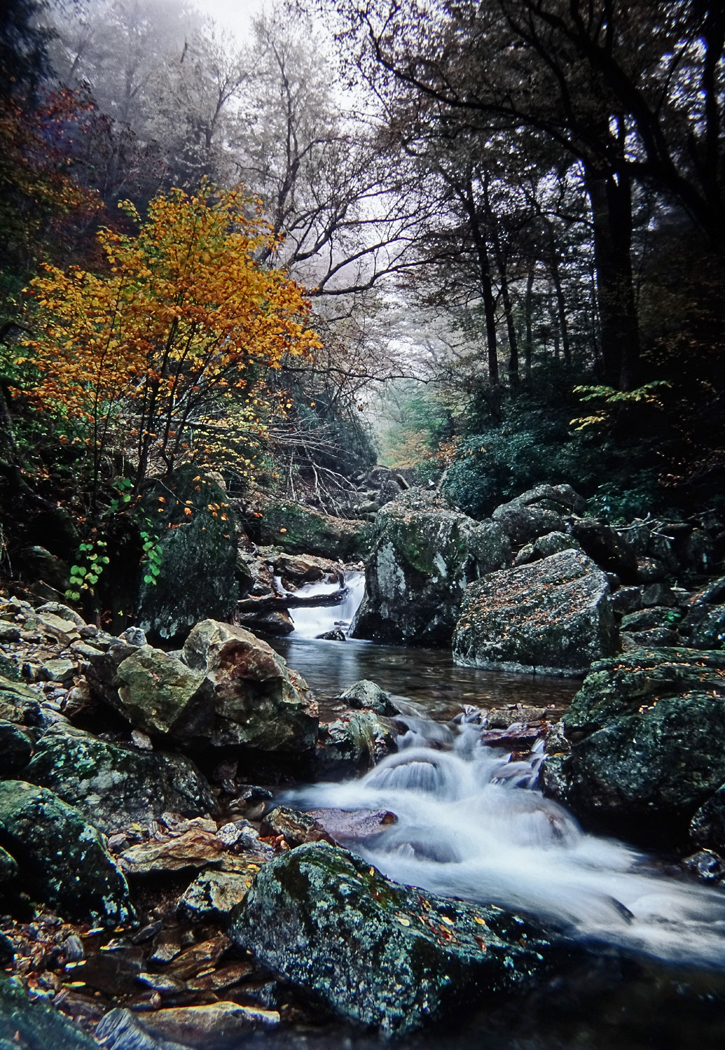
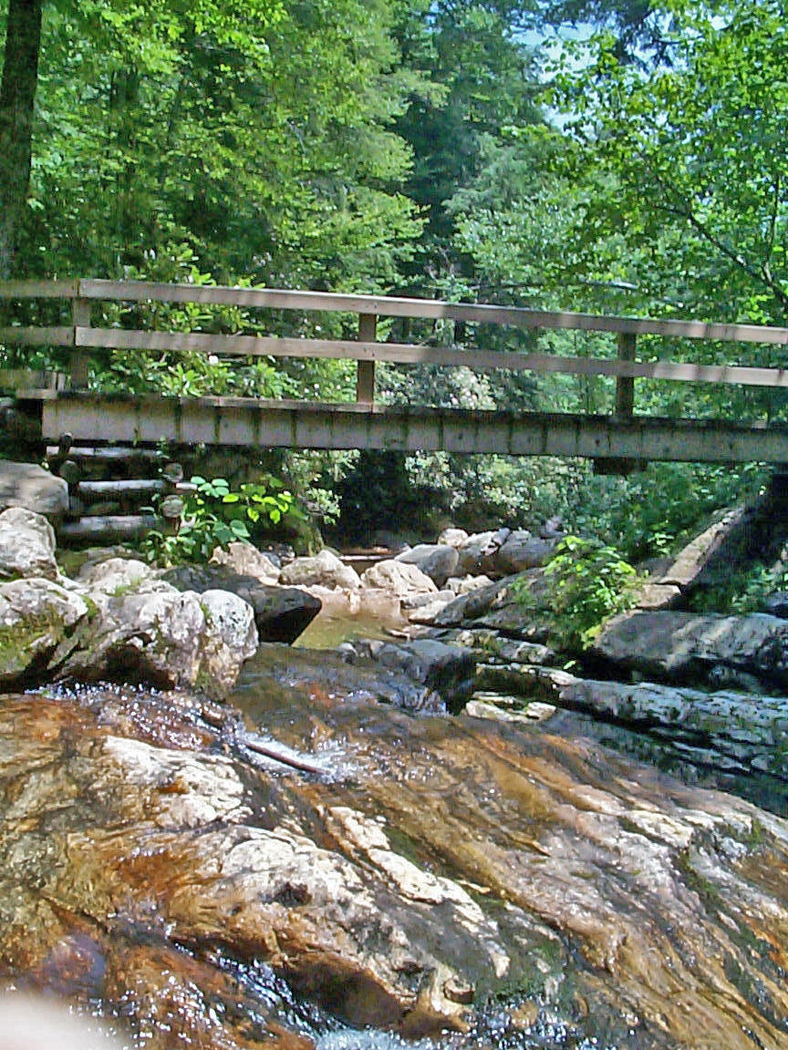
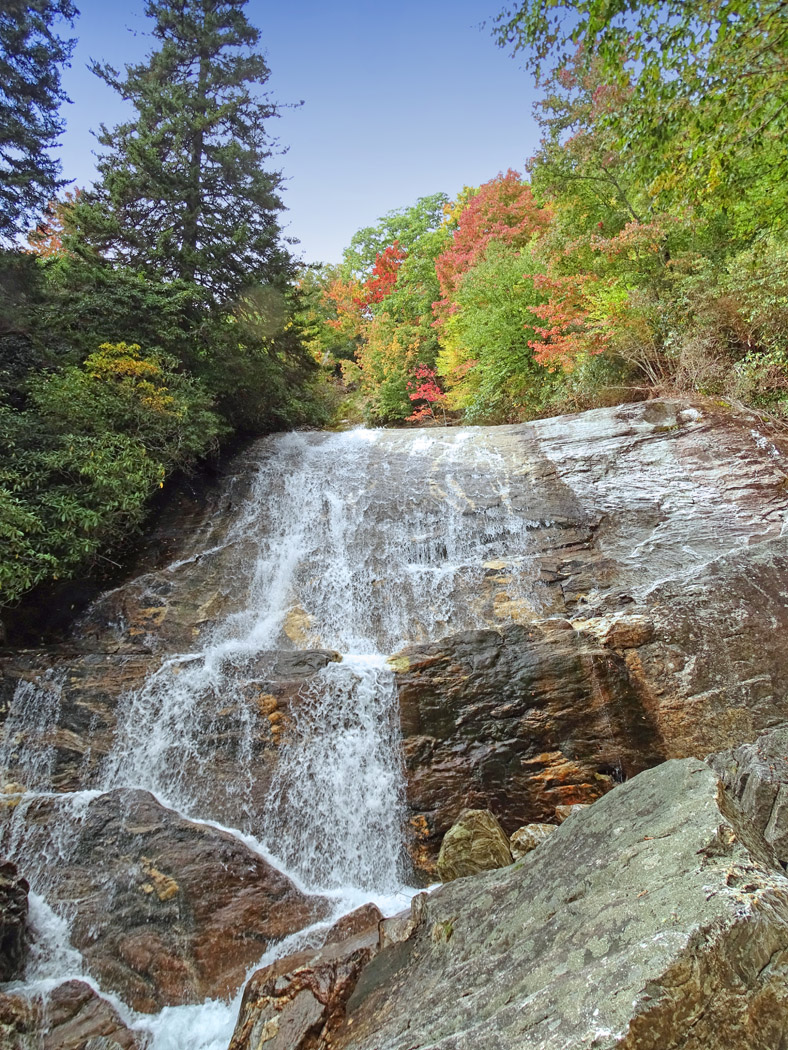
SKINNY DIP FALLS
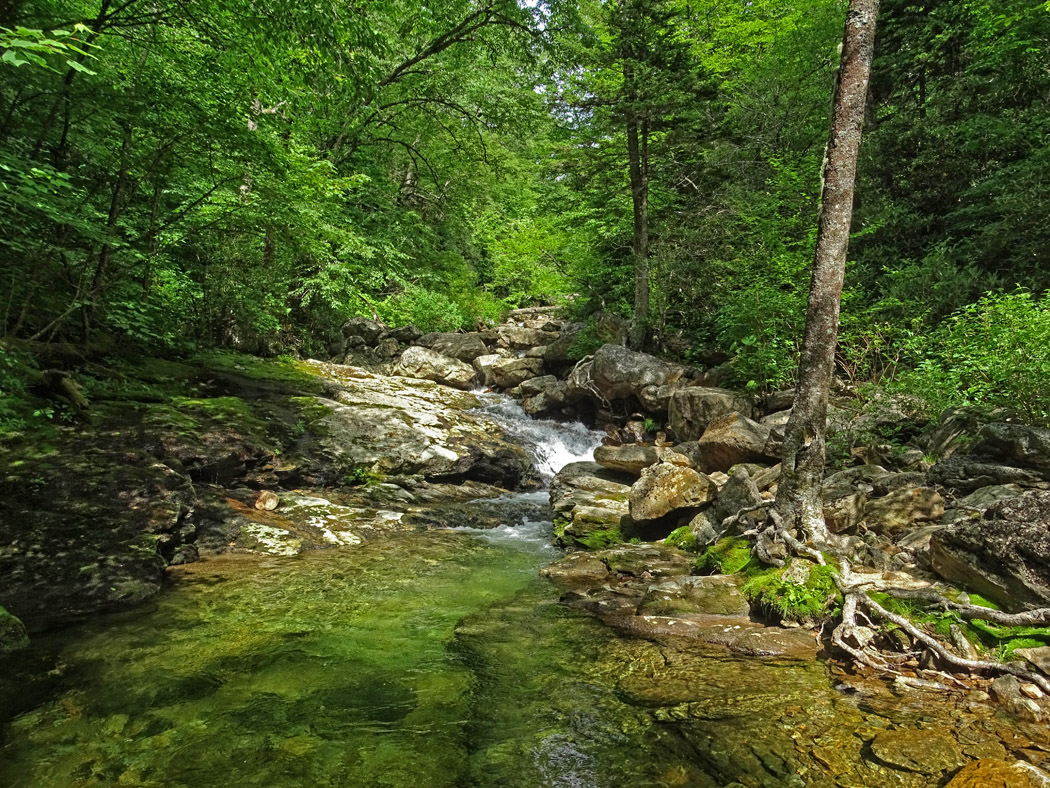
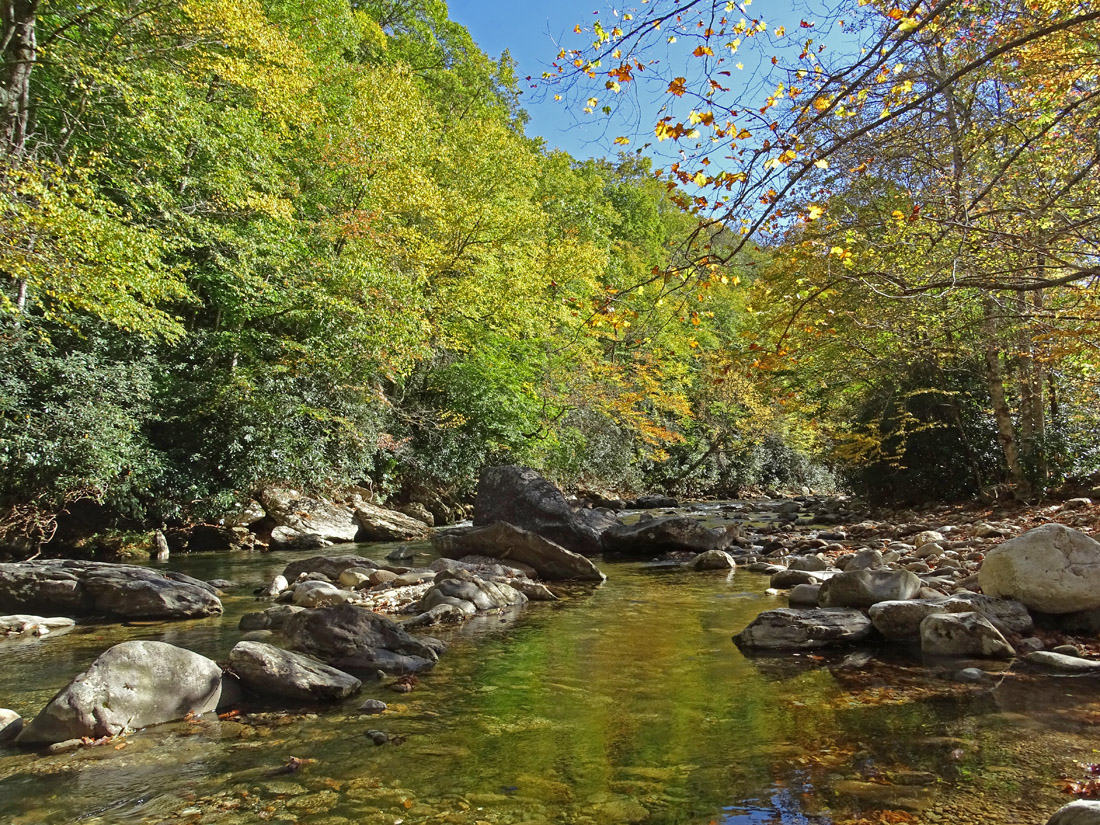
On September 9, 2021, I hiked a Pisgah National Forest trail to one of my favorite places called Skinny Dip Falls on Yellowstone Prong, about 3/4-mile off the Blue Ridge Parkway in Haywood County, North Carolina.
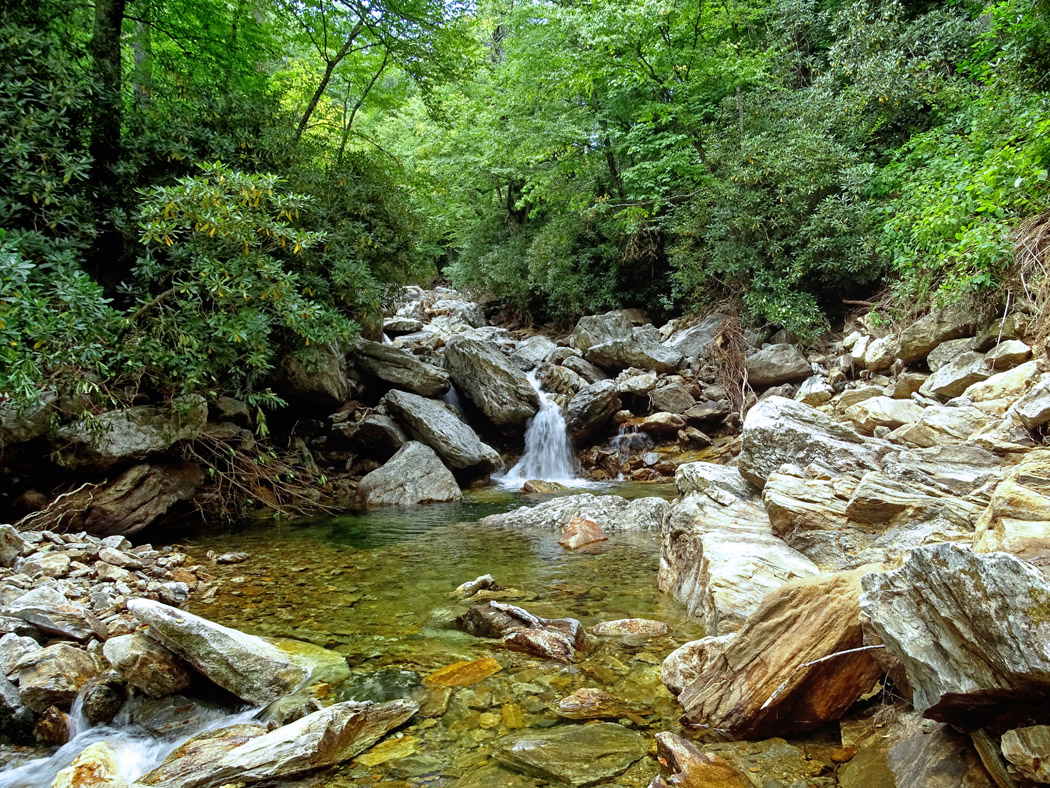
I have visited Skinny Dip Falls many times over the several decades I have lived in western North Carolina. The falls and prong have always been very photogenic regardless of the season.
1994
1994
1998
2000
2019
There was a time before the internet when pretty much only locals knew about Skinny Dip Falls. So, it was not unusual to have the place to myself when I went there. But after the precise location and pictures of it were splashed on the internet for all to see, it has become a very popular place, sometimes overrun with dozens of people, especially on a hot summer day. Google it to see what I mean.
My plan on the 9th was to get an early start to scramble up Yellowstone Prong from Skinny Dip Falls upstream to Yellowstone Falls; the latter I had read about on the NET but never before visited. I planned to continue westward beyond Yellowstone Falls into Graveyard Fields to pick wild blueberries I knew to be in season from having been there a week earlier with my wife, Chrissy.

8-31-21
Only a select few others would attempt the strenuous 1/2-mile boulder hopping and climbing scamper between the falls, so it was a good way to separate myself from the crowd that would no doubt soon assemble at Skinny Dip Falls. I'd hike southward from Graveyard Fields via the Parkway to the Skinny Dip Falls trailhead at the Looking Glass Rock overlook where I had parked my truck and began.
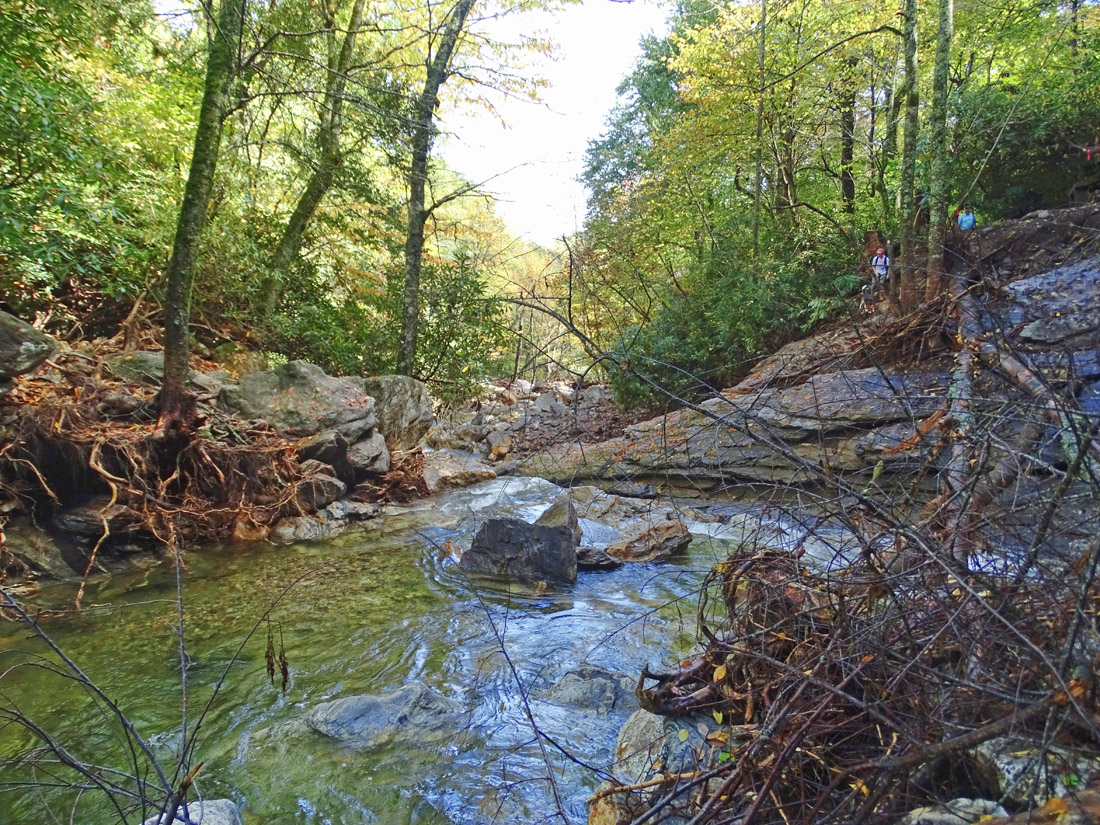
When I arrived at a familiar overlook of the falls at the head of wooden stairs leading down to a bridge that crosses the stream, I was shocked to find both were gone and the landscape below had somehow been transformed into a scene I did not recognize; the falls as I knew them were also gone!
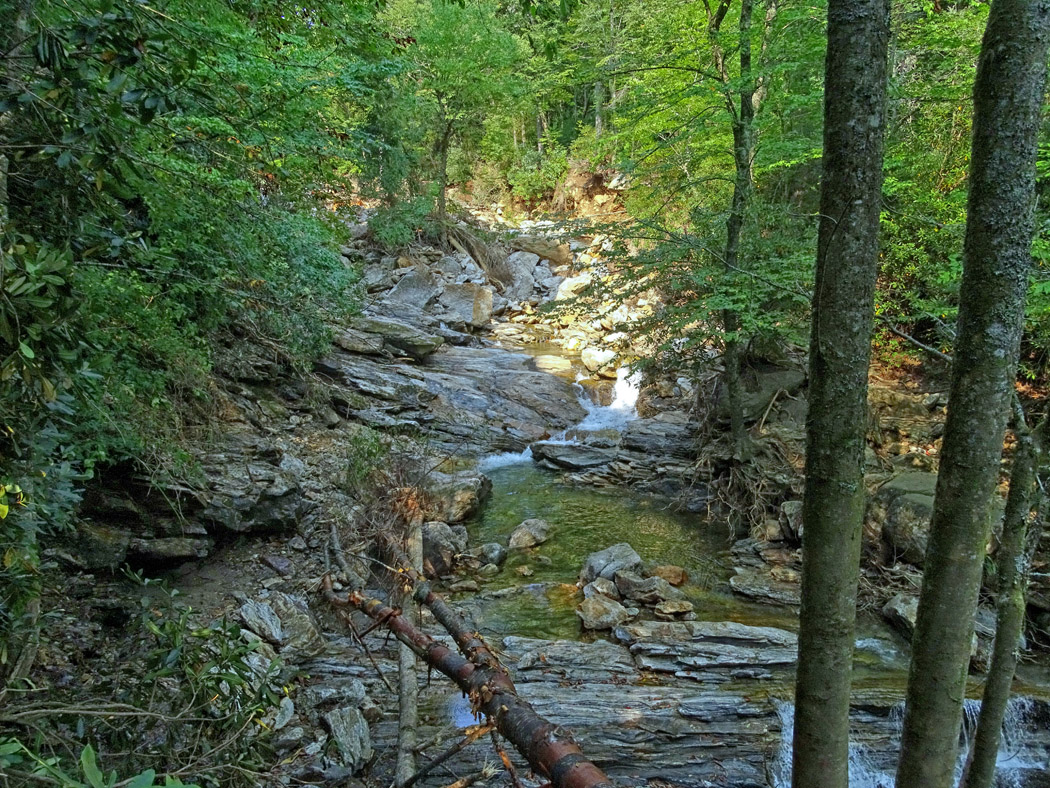
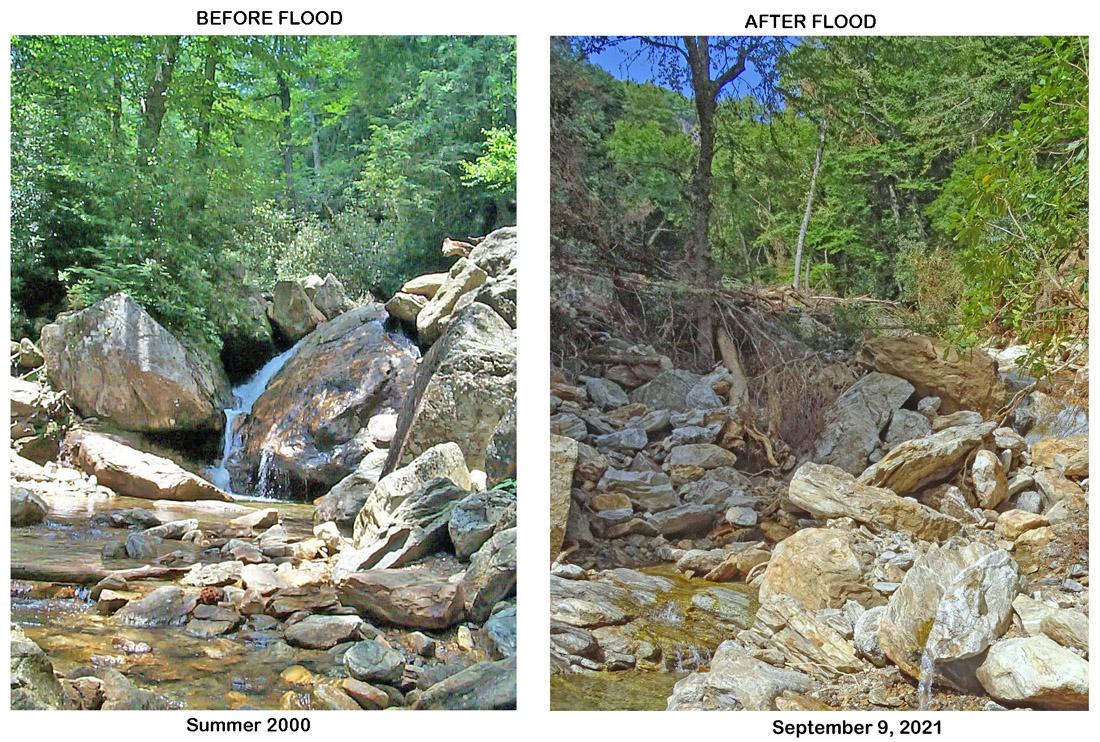
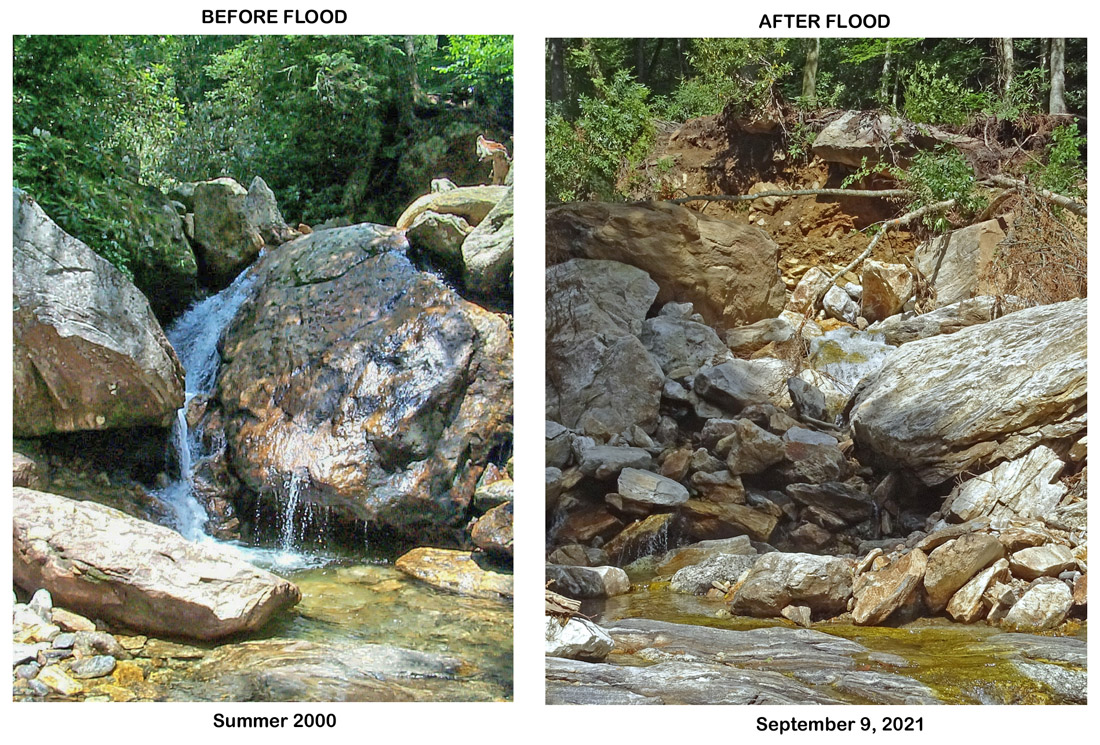
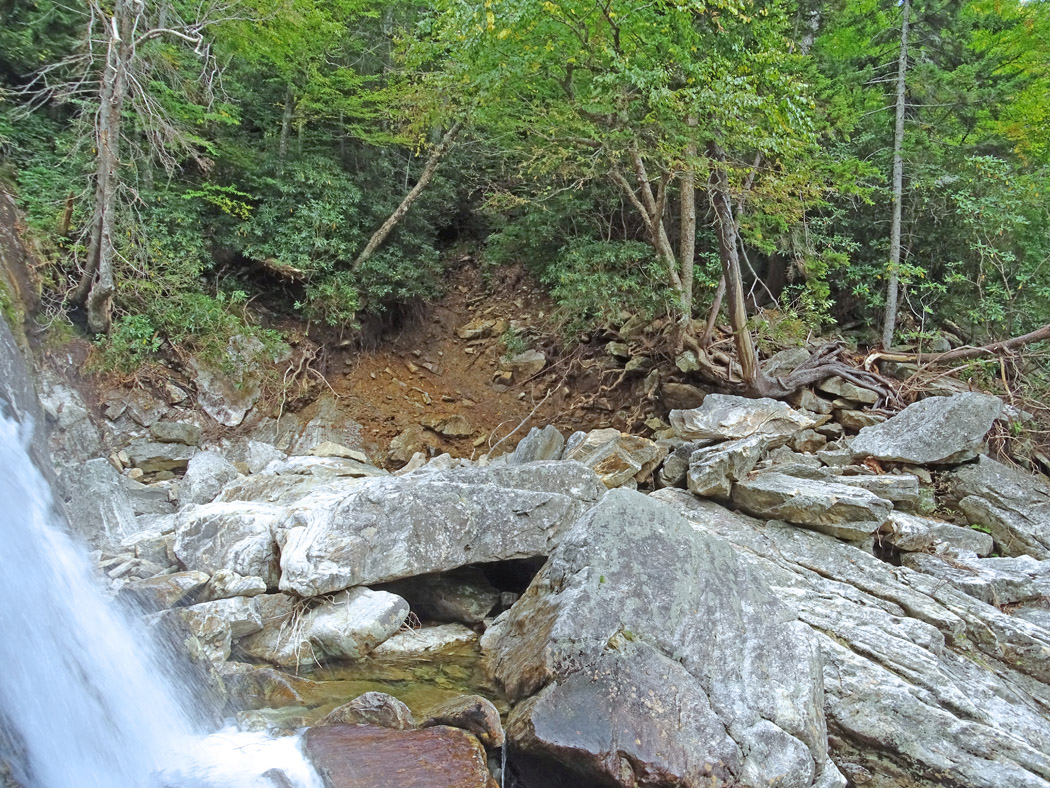
The post-flood remains of Skinny Dip Falls - September 2021
So as to not turn back simply because of a lack of infrastructure, I carefully made my way down a treacherous slippery slope where the stairs had once been, jumped over a narrow part of the prong below the former bridge location and began making my way upstream.
Although disappointed with the demise of the falls, as a geologist I was intrigued and dare I say excited by what I was seeing; it felt like I was experiencing geology in "real-time" as geologic events that so drastically rearrange landscapes are few and far between. I was in awe of a force powerful enough to move and pile up huge multi-ton boulders and massive whole trees, smaller trees, branches and other debris into enormous rock piles and snags. Streambanks had been cut back as much as 15 feet in spots leaving behind trees with exposed roots that now hang over the prong's new channel. The Appalachians that once reached around 30,000 feet elevation during the peak of the last tectonic mountain building event about 250 million years ago have ever since been subjected to the processes of erosion that have worn down the highest peak at Mt. Michell to only 6,684 feet. Erosion on steroids had happened to Yellowstone Prong in the Appalachian Mountains' perpetual bit by bit march toward the sea.
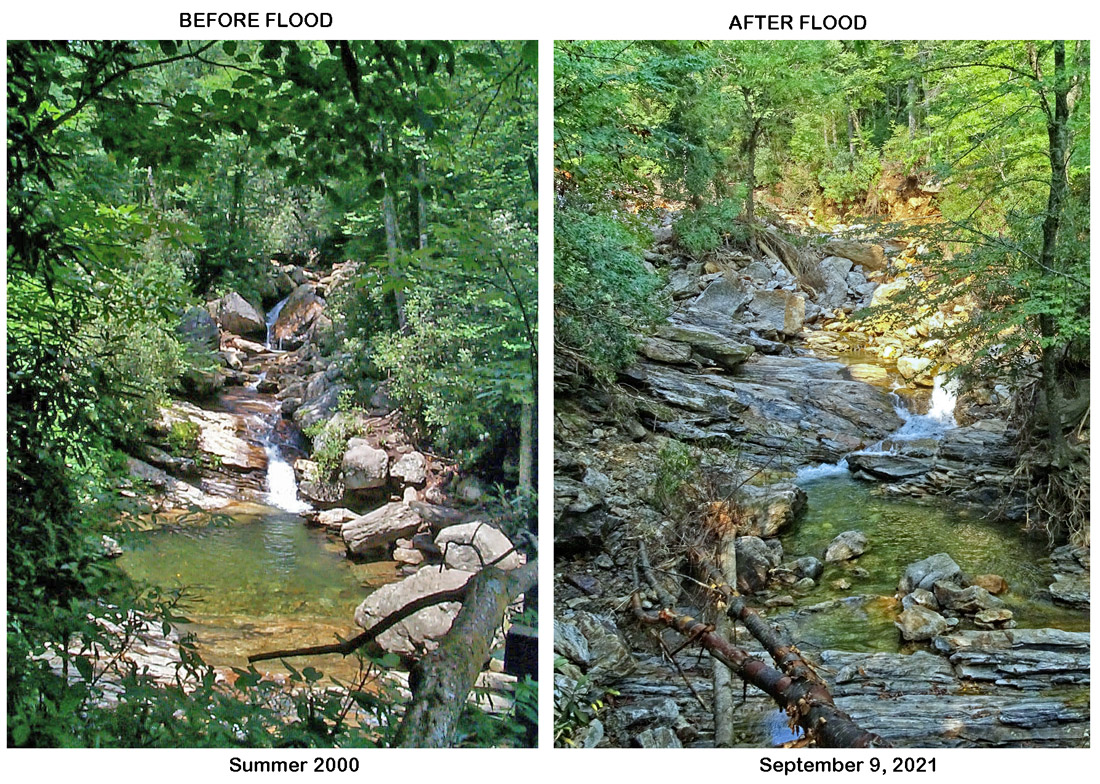
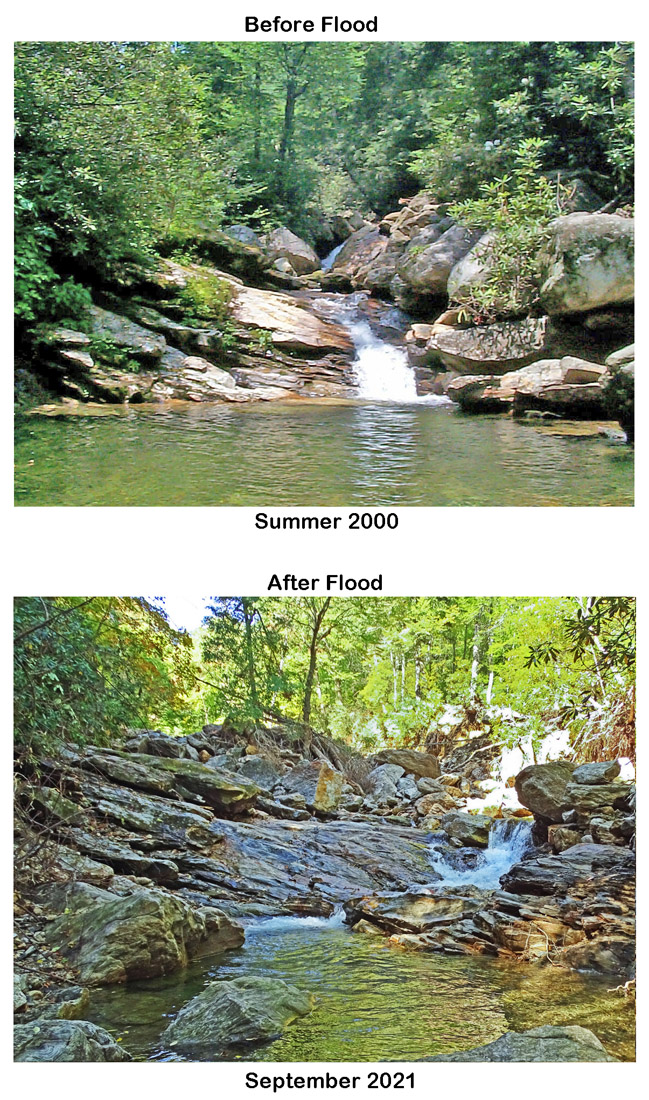
The following before and after pictures demonstrate some of the rearrangement in the immediate area of the former falls.
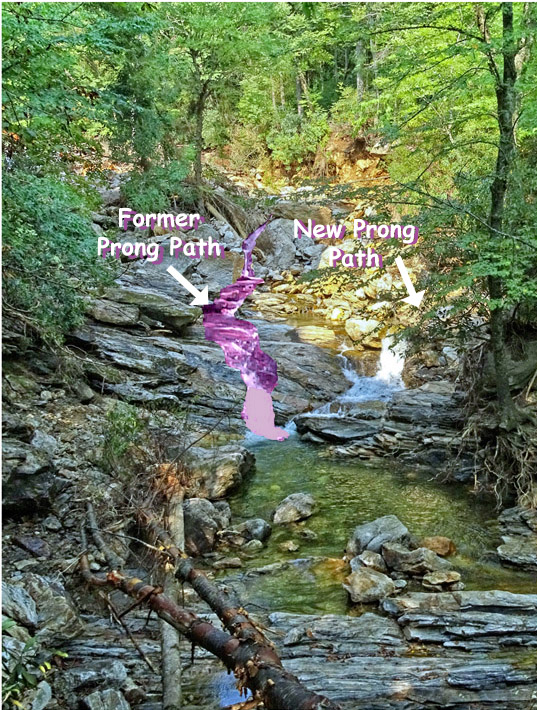
The following picture illustrates the dramatic change in stream's path (old path illustrated in pink)
As I scrambled upstream beyond where the falls had once been, I became even more amazed by the havoc wrought by what must have been a powerful flood and associated debris flows and landslides. But before I continue with more pictures and geologic explanations for what happened at Skinny Dip Falls and Yellowstone Prong, I feel it prudent to turn back the clock to mid-August when a devastating flash flood occurred in and around the Cruso community on the East Fork of the Pigeon River in Haywood County. After all, the record-breaking flood that struck Cruso on August 17, 2021 must have begun in Yellowstone Prong since its confluence with Dark Prong about 1/4-mile downstream from Skinny Dip Falls is where the East Fork begins.
RAIN, FLOODING AND DEBRIS FLOWS
EAST FORK OF PIGEON RIVER & BEYOND
According the US Weather Service, parts of western North Carolina endured days of heavy rain from Saturday, August 15th through Sunday, August 16th, 2021 as moisture moved in from the south to fuel locally intense thunderstorms. Up to 10 inches of rain fell over a localized area near the Transylvania and Jackson County border on the morning of the 16th. This resulted in significant flash flooding near the headwaters of the French Broad River in Transylvania County, where an automated gauge at Rosman reported its highest level in almost 30 years. The period of thunderstorms was followed by Tropical Storm Fred that brought even more rain to the region. Between midnight, August 15th and 5 pm, August 17th, a weather station at the Cruso Fire Department in Haywood County picked up 14.17 inches of rain, according to Local Yokel Weather. Between midnight the 15th and 4 pm the 17th, Rock Bridge adjacent to Panthertown Valley in Jackson County reported 12.4 inches, the Balsam Grove Fire Department in Transylvania County reported 12.28 inches and Wolf Creek Lake in Jackson County saw 11.38 inches, Local Yokel reported.
Fred arrived in the southern Appalachians on the morning of the 17th. Tropical moisture combined with prolonged southeast upslope flow into the Blue Ridge escarpment resulted in incredibly heavy rainfall across the northeast Georgia and western North Carolina mountains. As bands of rain surrounding the remnant circulation of Fred developed over the region, additional heavy rainfall within the upper French Broad basin caused a new round of flash flooding during the late afternoon and evening. This time, the Rosman gauge exceeded its August 16th reading, reaching major flood stage and the highest level in 57 years. Two-day rainfall totals of up to two feet occurred in western Transylvania County near Lake Toxaway.
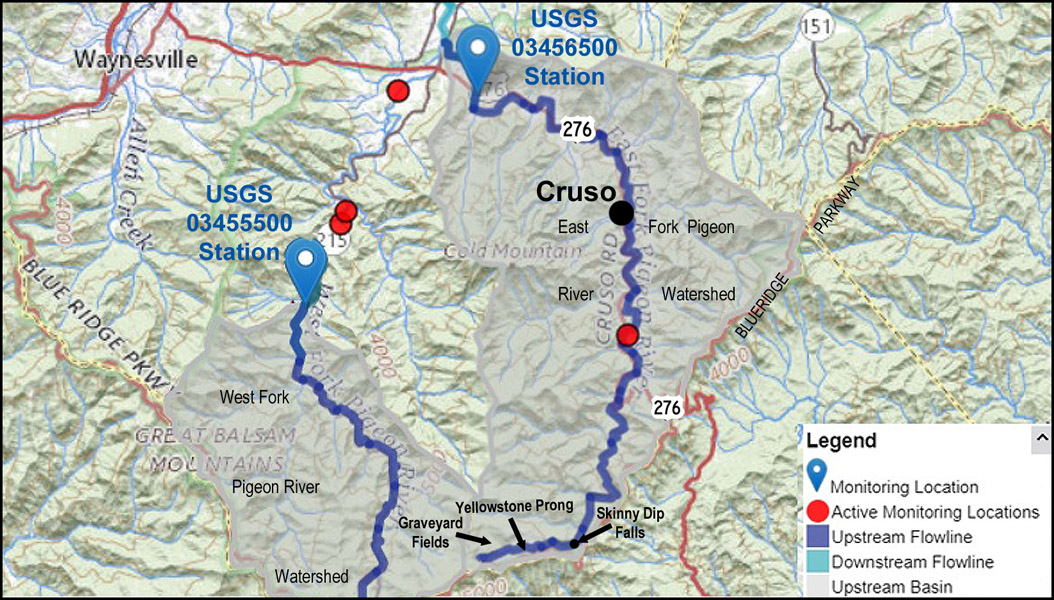
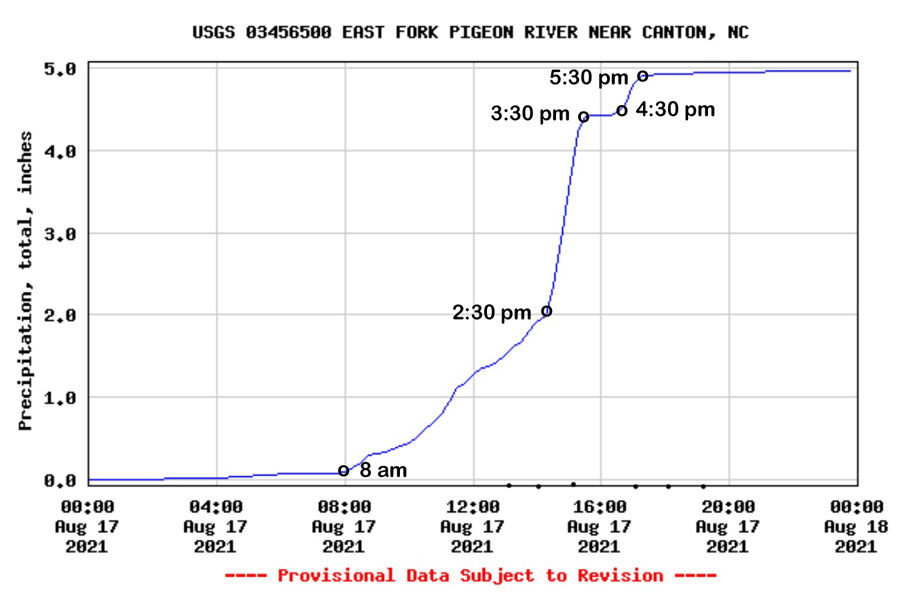
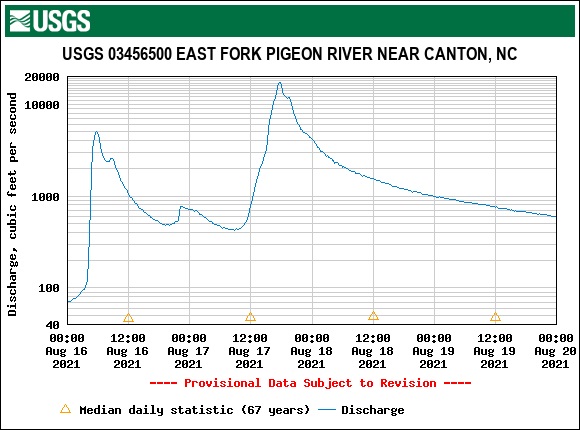
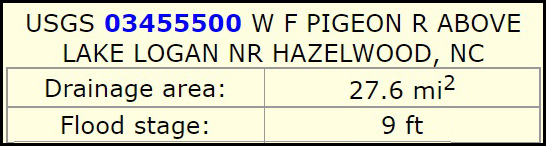
From morning through late afternoon on the 17th, constant heavy rain fell over the Balsam Range resulting in major flash flooding in the headwaters of the Pigeon River in southern Haywood County. The nearest USGS rain gauge to Yellowstone Prong is on the East Fork of the Pigeon River near Cruso, about 9 miles away as the crow flies. This gauge recorded a total of about 5 inches of rain from 8:00 to 5:30 pm; nonstop heavy rain that began at 8:00 am nearly doubled in intensity from 2:30 pm to 3:30 pm, stopped for an hour, started up again at 4:30 pm, and persisted until it finally stopped for good that day at 5:30 pm. It is important to note that higher elevations, especially near ridge lines, tend to get much more rain than lower elevations, so it is possible if not likely the drainage area for Yellowstone Prong, including Graveyard Fields, received much more than 5 inches.
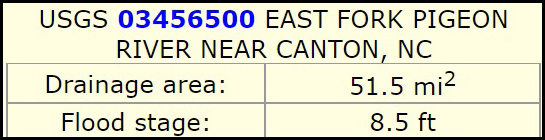
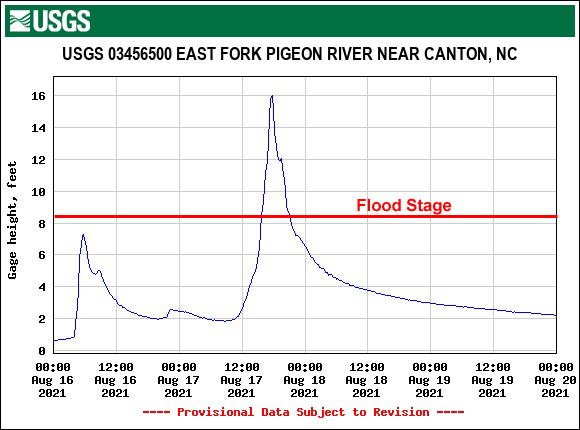
According to a USGS stream gauge at the same location of the "USGS East Fork Pigeon River Near Canton" rain gauge, the river rose more than 2.5 feet in only 30 minutes starting around noon on the 17th. By around 6 pm that day, the East Fork reached its peak of just over 16 feet or 7.5 feet above flood stage, exceeding its previous record by more than 3 feet.
 : :
|
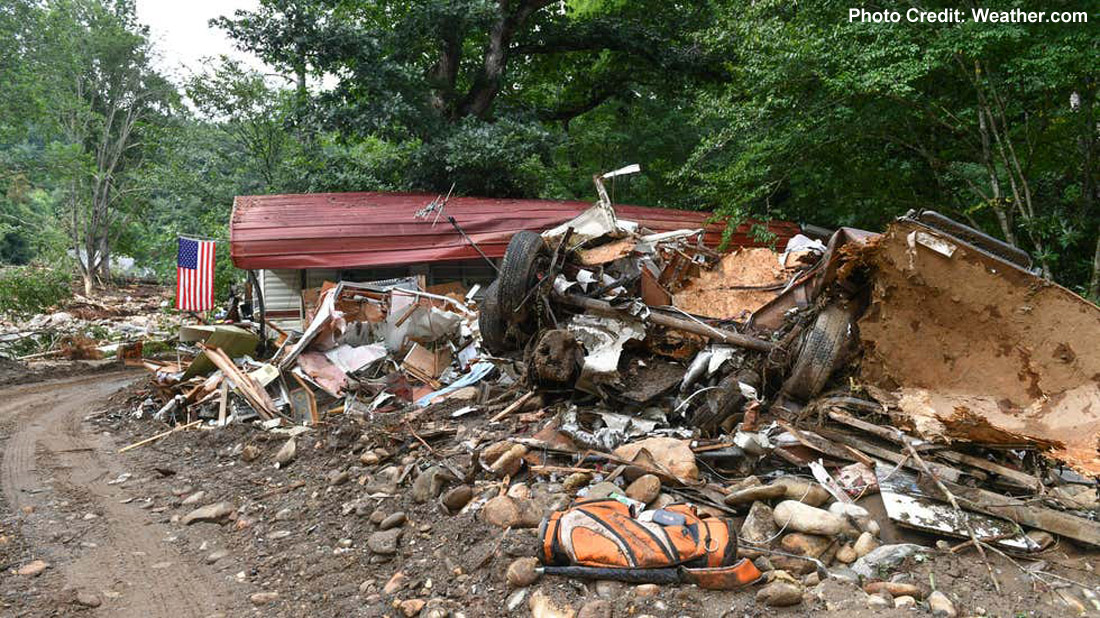
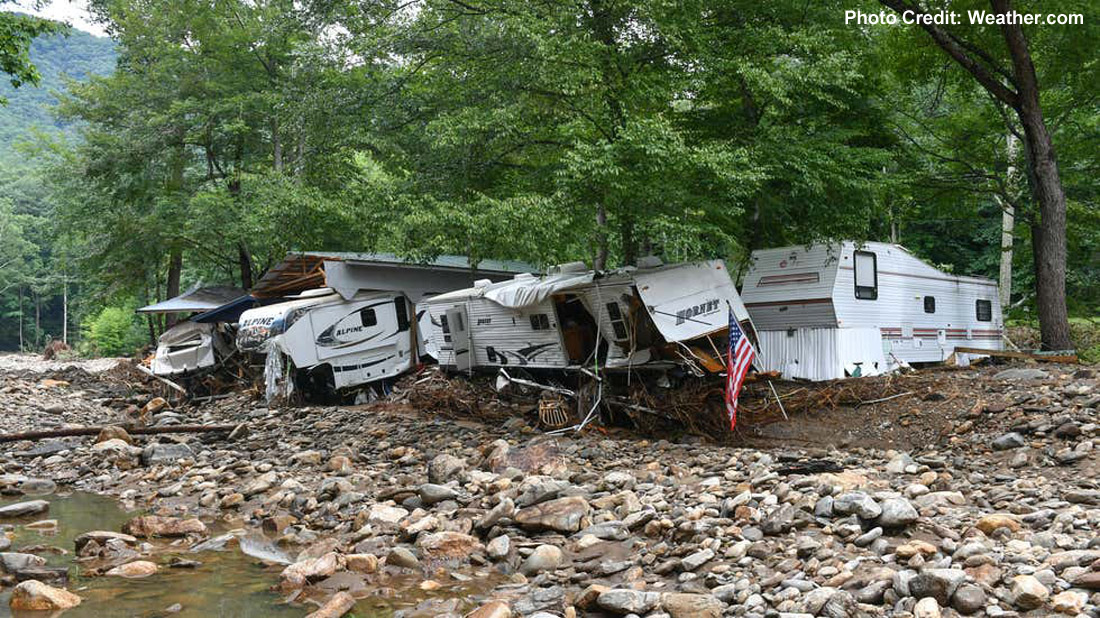
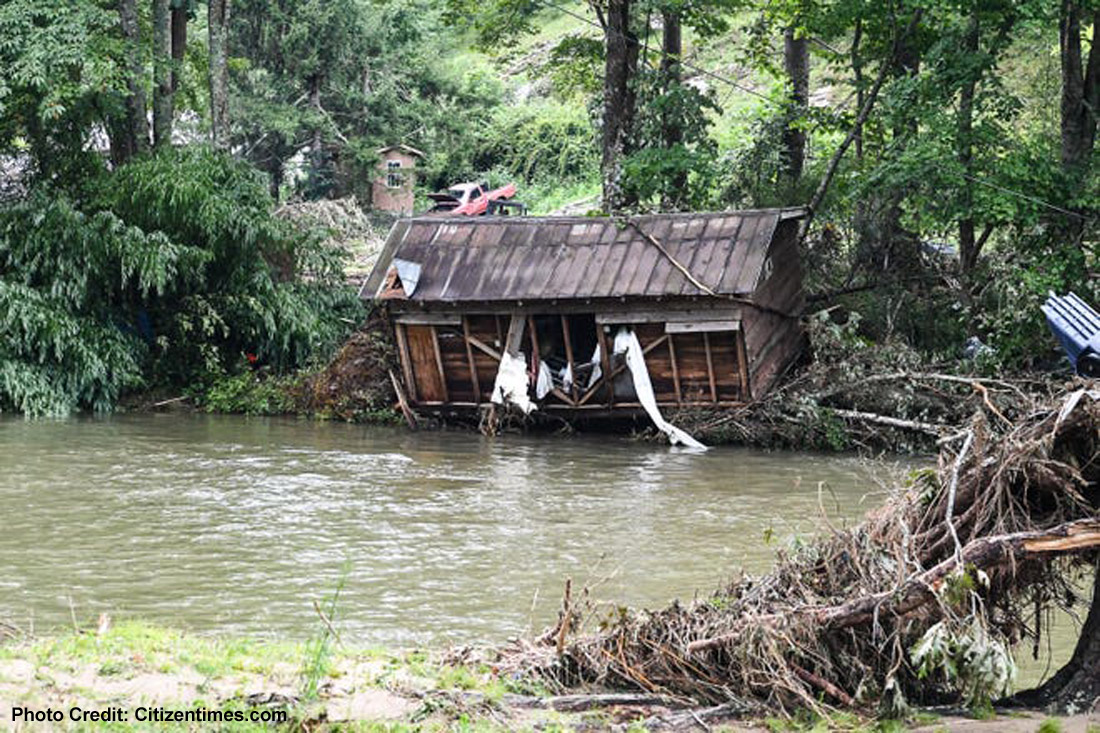
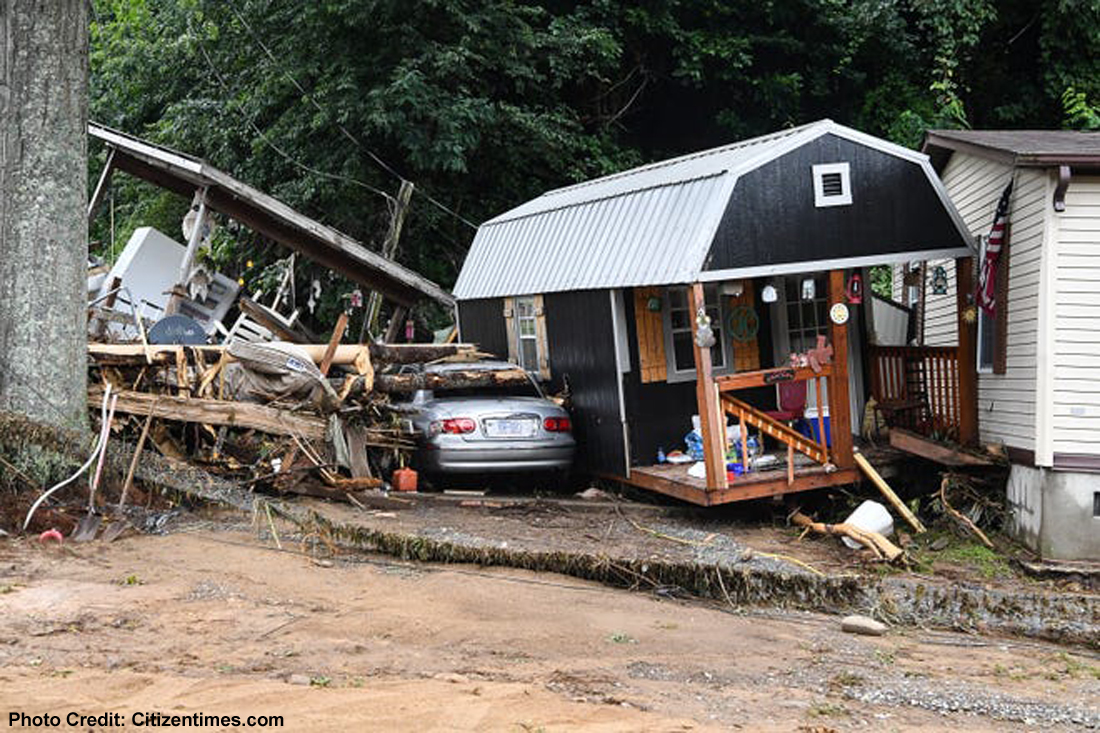
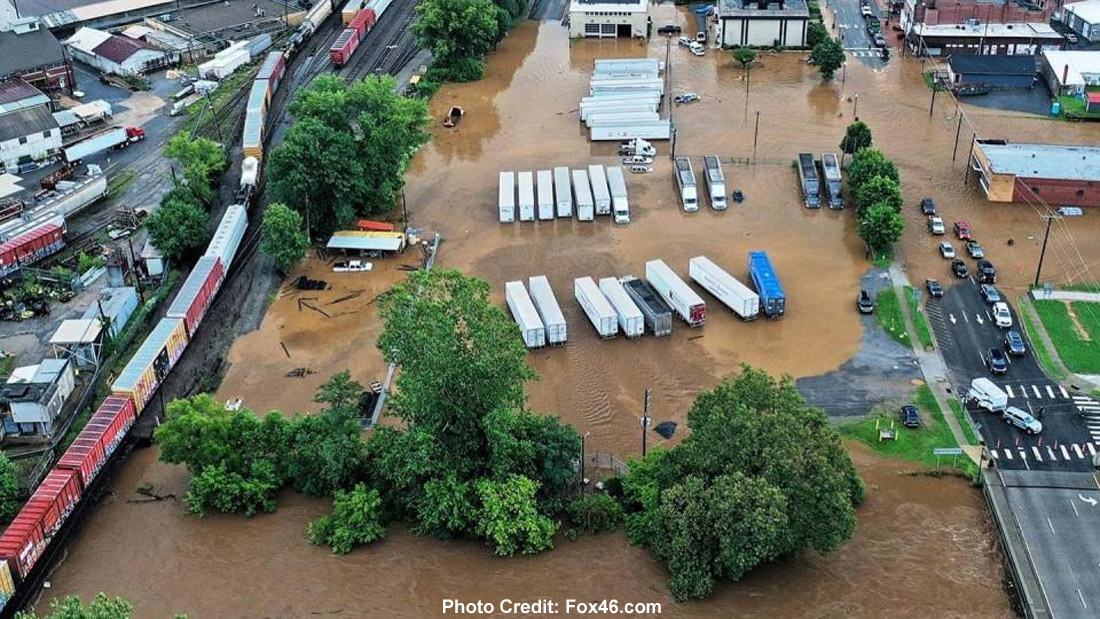
Catastrophic flash flooding and associated major landslides and debris flows occurred along the East Fork in the rural community of Cruso causing devastating property damage and loss of life. Six fatalities were confirmed in this area with tens of millions of dollars in property damage. 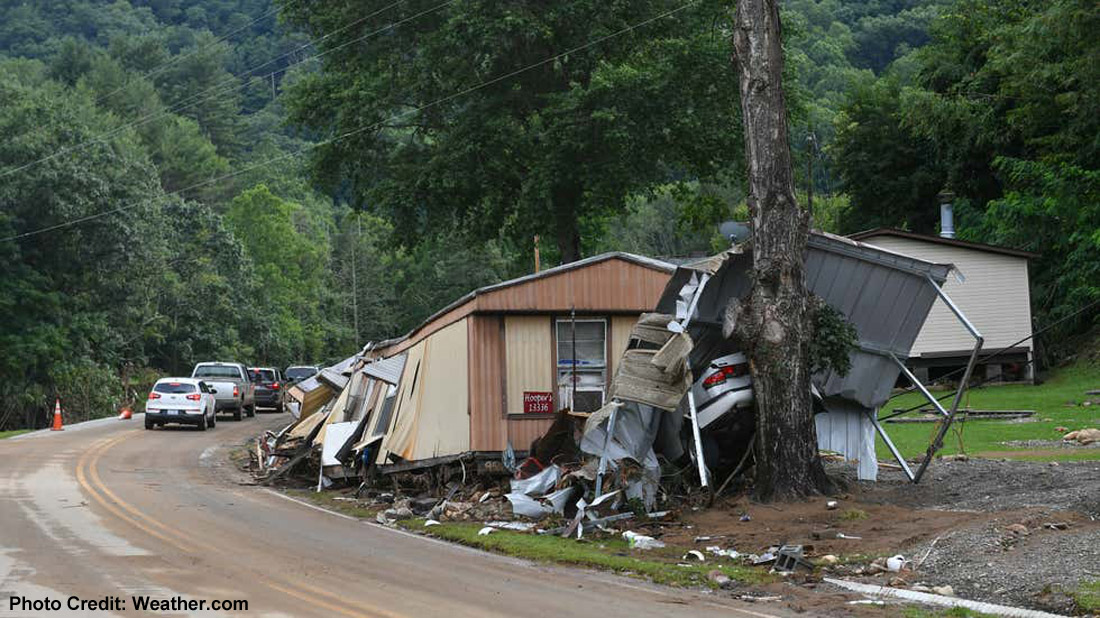
|
This report will include pictures and description of landslides and debris flows. Therefore it is prudent to define these terms for those of you who may not be as up on your geology as perhaps you'd like.

Types of Landslides in this report.
According to the United States Geological Survey, "A landslide is defined as the movement of a mass of rock, debris, or earth down a slope. Landslides are a type of "mass wasting," which denotes any down-slope movement of soil and rock under the direct influence of gravity. The term "landslide" encompasses five modes of slope movement: falls, topples, slides, spreads, and flows. These are further subdivided by the type of geologic material (bedrock, debris, or earth)."(source: USGS.gov)
"Almost every landslide has multiple causes. Slope movement occurs when forces acting down-slope (mainly due to gravity) exceed the strength of the earth materials that compose the slope. Causes include factors that increase the effects of down-slope forces and factors that contribute to low or reduced strength. Landslides can be initiated in slopes already on the verge of movement by rainfall, snowmelt, changes in water level, stream erosion, changes in ground water, earthquakes, volcanic activity, disturbance by human activities, or any combination of these factors." (Source USGS.gov)
Debris flows, sometimes referred to as mudslides, mudflows, lahars, or debris avalanches, are common types of fast-moving landslides. These flows generally occur during periods of intense rainfall or rapid snowmelt. They usually start on steep hillsides as shallow landslides that liquefy and accelerate to speeds that are typically about 10 mph, but can exceed 35 mph. The consistency of debris flows ranges from watery mud to thick, rocky mud that can carry large items such as boulders, trees, and cars. They are among the most numerous and dangerous types of landslides in the world. They are particularly dangerous to life and property because of their high speeds and the sheer destructive force of their flow. This wide variation in grain size results in accumulations or deposits of material at the outlet of a drainage basin that are poorly sorted, or in other words, all mixed up together." (source: USGS.gov)
|
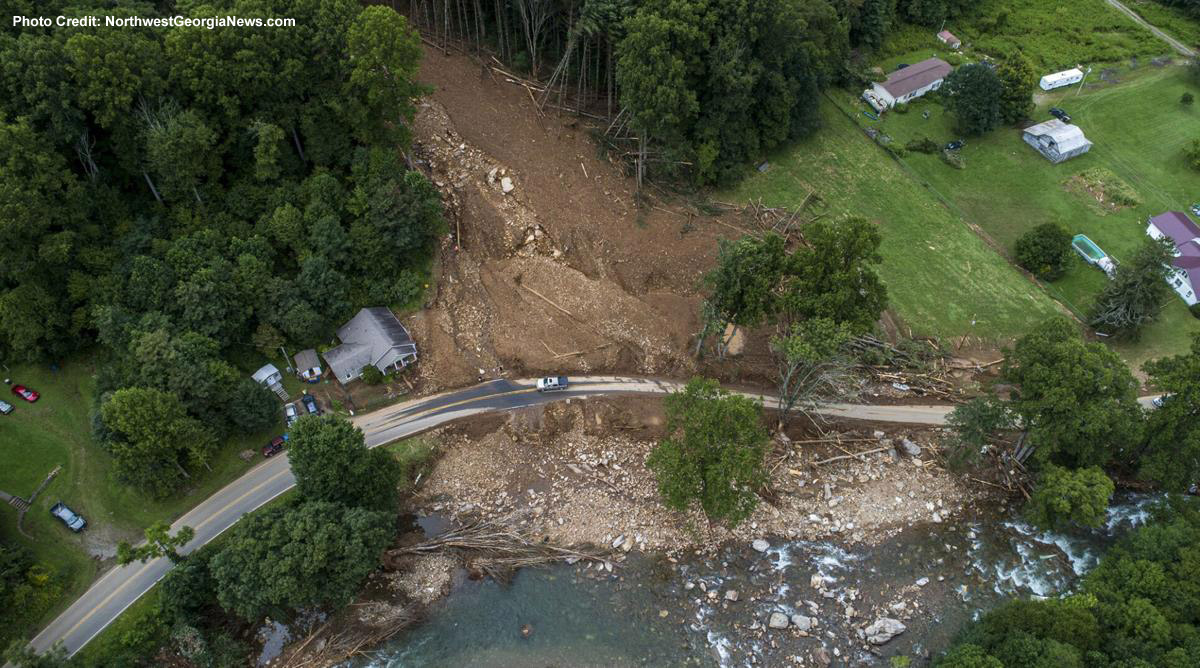
Aerial view of debris flow that completely destroyed a home
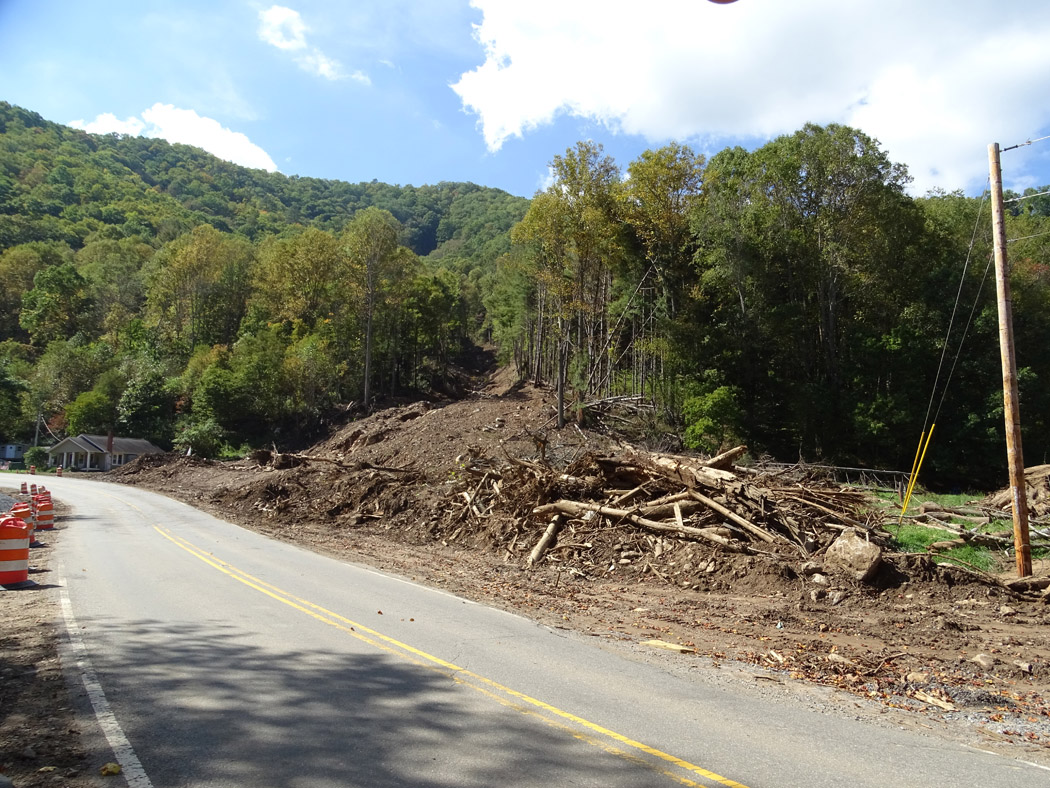
Ground level view of debris flow - a house once stood where the logs are stacked to the right. (10-10-21)
10-10-21
10-10-21
10-10-21
10-10-21
10-10-21
As the deluge worked its way downstream, major flooding developed on the Pigeon River in Canton for the first time in almost 20 years, reaching its fourth highest level on record since 1928.
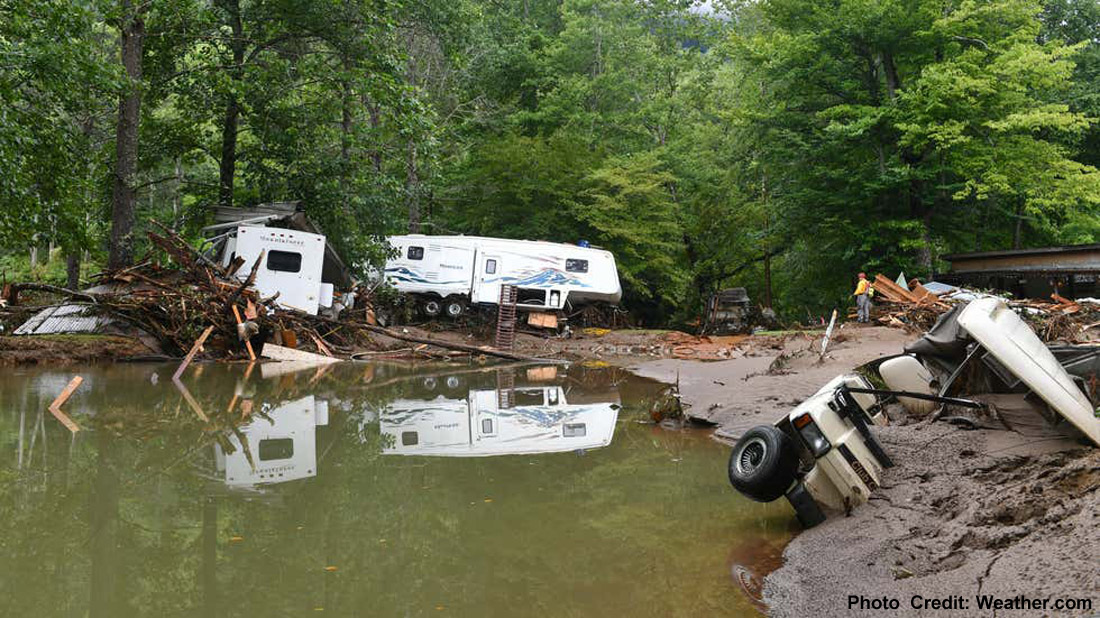
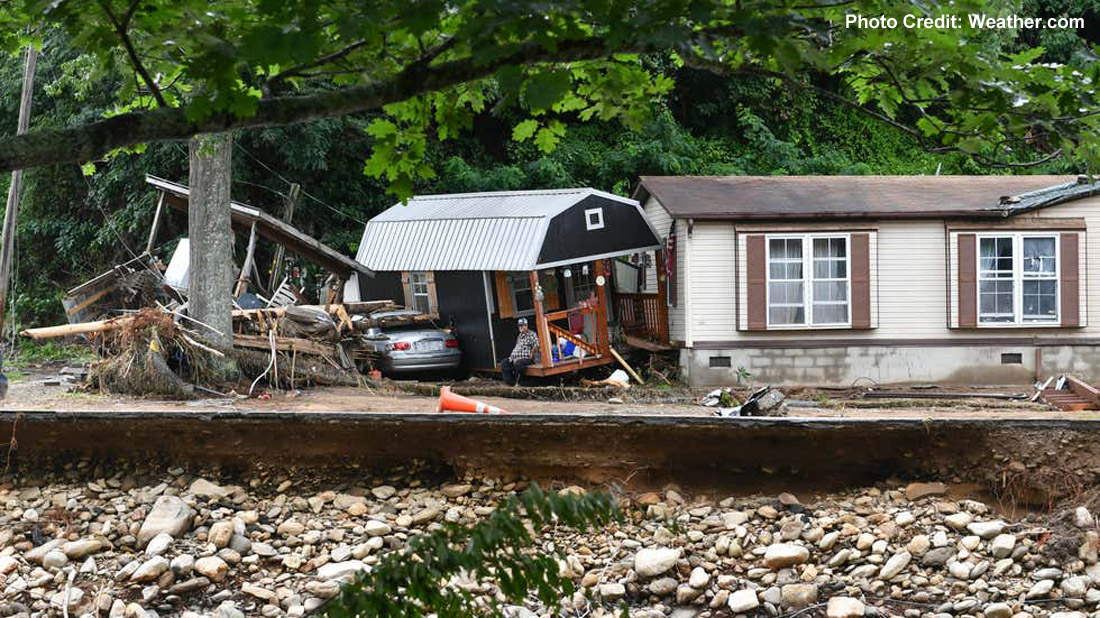
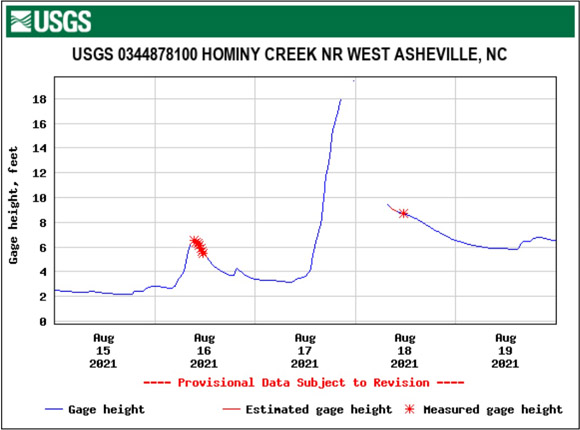
The same August 2021 rain event that caused the historic flooding along the East Fork also caused flooding throughout western North Carolina. Rivers and streams exceeded their banks and many roads were blocked by flooding. There were numerous reports of mobile homes, sheds and automobiles carried away by floodwaters. Hominy Creek in southwestern Buncombe County rose from its normal level of about 2 feet to 18 feet when a USGS stream gauge in West Asheville stopped working.
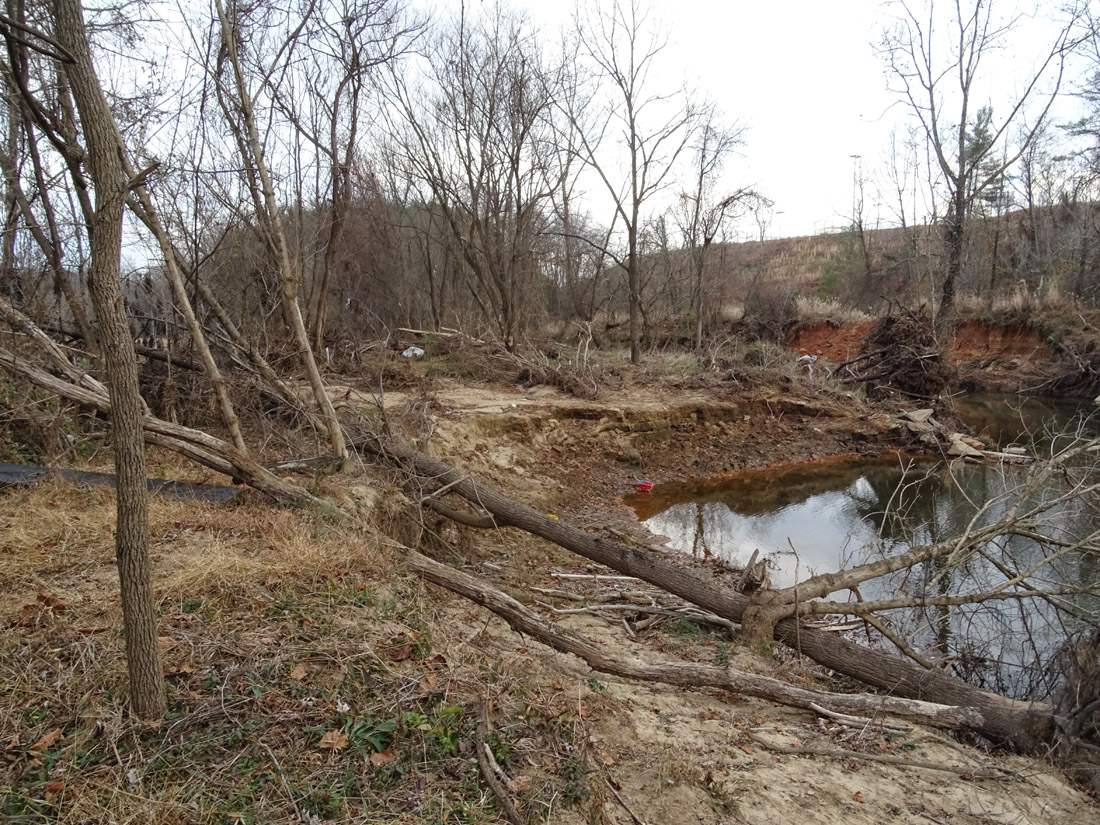
Eastward view of trees and debris piles left behind by flooding on Hominy Creek in Enka. (12-4-21)
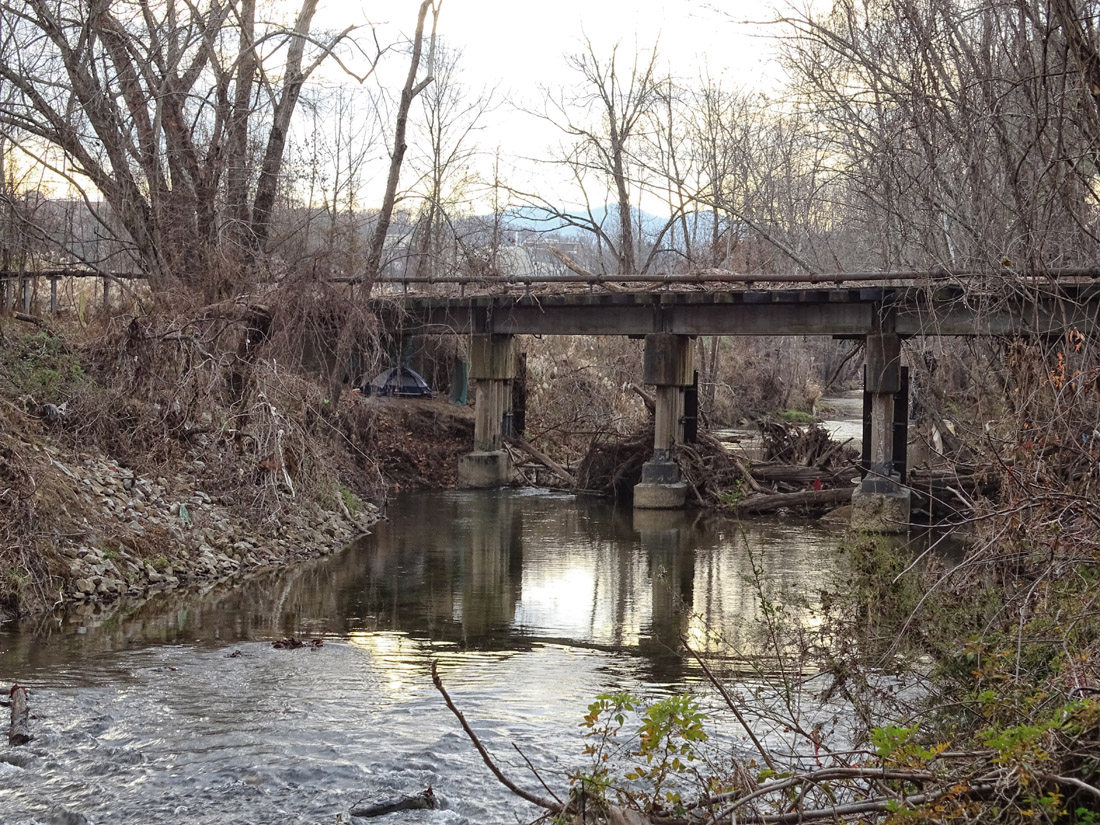
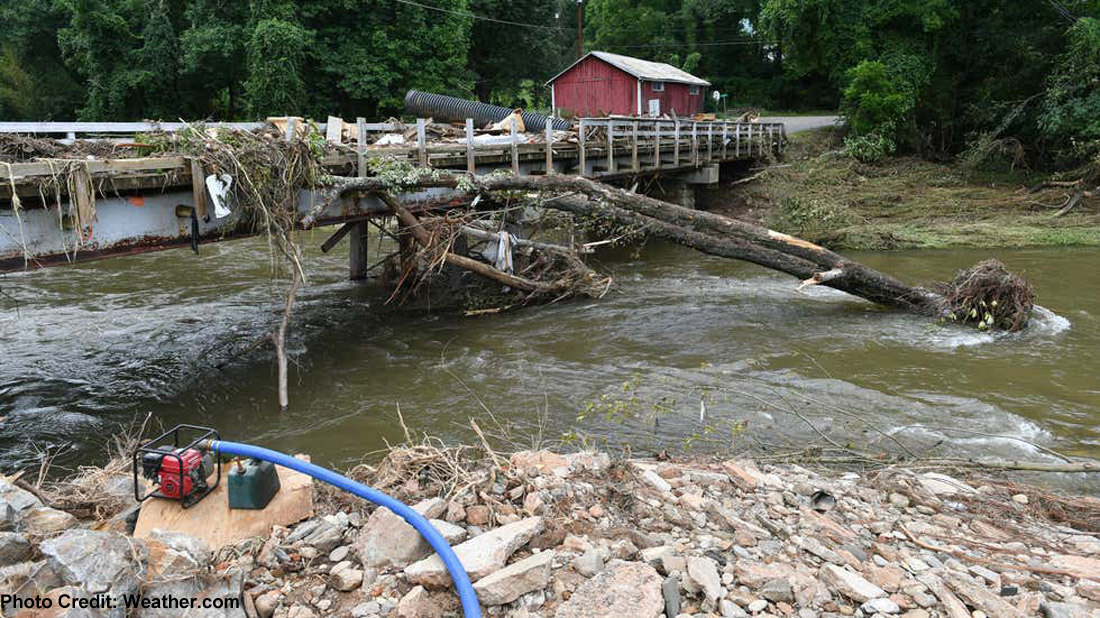
Westward view of abandoned railroad bridge to former American Enka Company Plant circa 1928. (12-4-21)
The top of the bridge is 14 feet above the water surface. The inhabitants of the current makeshift
homeless encampment would not have survived had they been there during the flood.
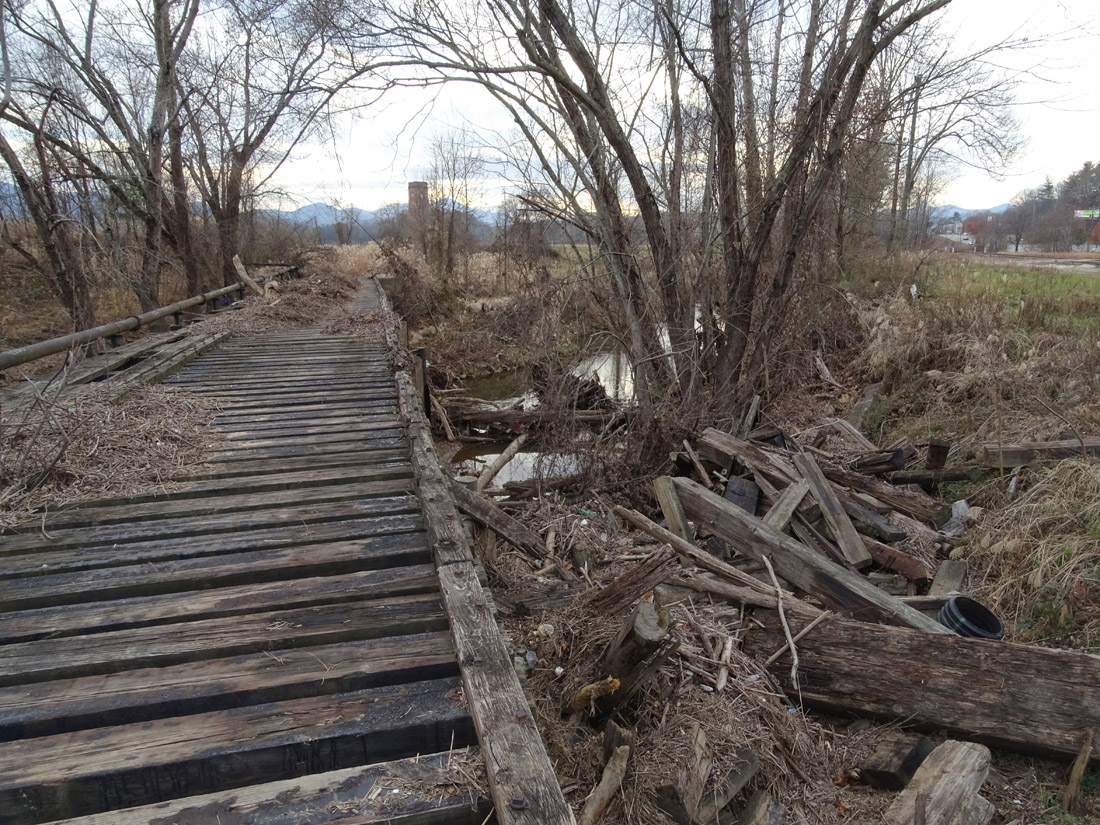
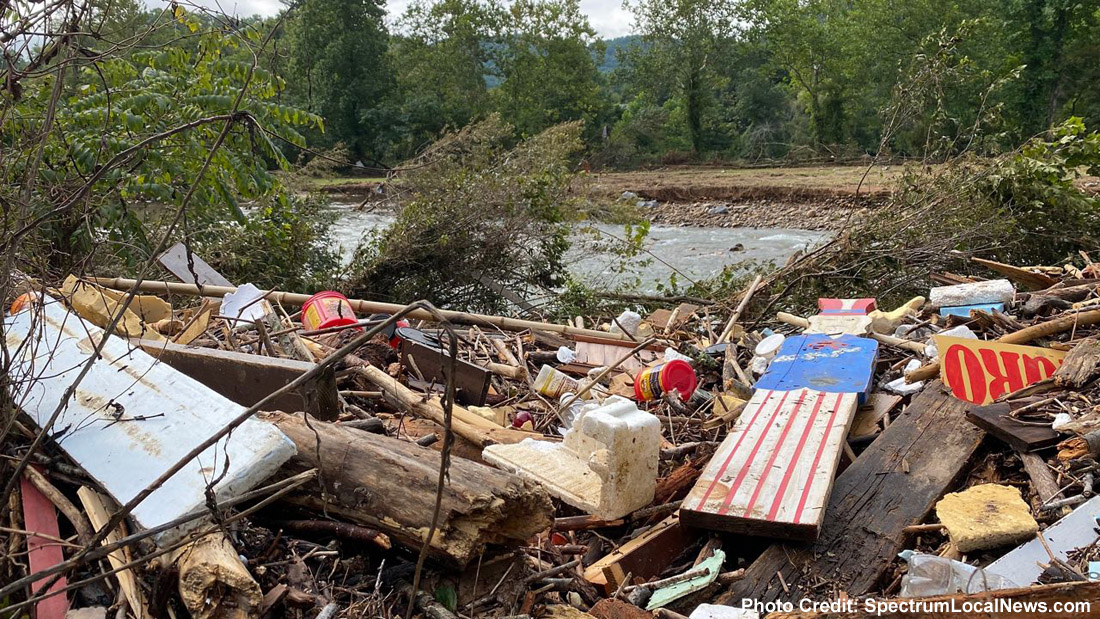
Debris left behind on and adjacent to the bridge by the flood. (12-4-21)
I stumbled across the following picture during my internet research of a flood of similar magnitude that occurred at the former American Enka Company Plant on Hominy Creek in 1940.
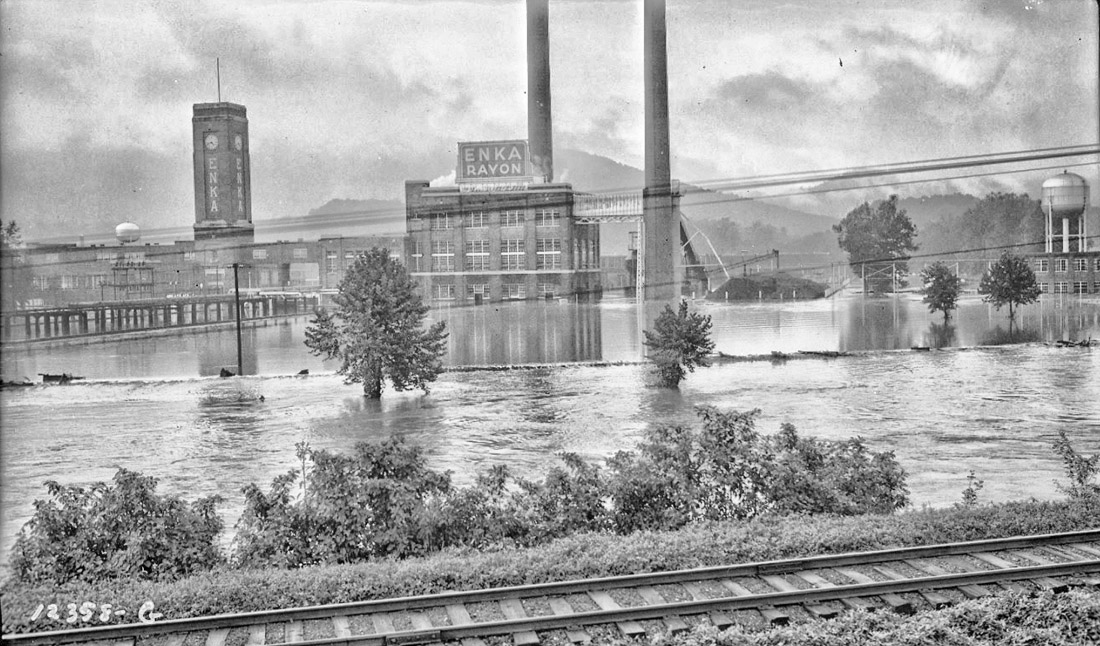
Hominy Creek is just beyond the railroad tracks and before the 1st tree. The surface of the
stream would not be visible at this angle if at its normal level. (Source: Wikipedia)
The Southwest continuation of the railroad bridge over Hominy Creek can be seen near the center left of the picture. A comparison between 1894 and 2019 topographic maps demonstrates that extensive removal of earth and grading must have taken place to create the large, flat, and significantly lower (than before) area on which to build the plant. This made the plant area more prone to flooding as demonstrated for the first time in 1940. Sometime after the 1940 flood, extensive flood control measures were instituted, including construction of earthen and concrete berms and levees up to 12-ft above than the uppermost bank of Hominy Creek, a series of interconnected floodwater containment basins with an emergency overflow spillway, massive dewatering pumps and more. Flood containment measures would ultimately fail and the property was again inundated with destructive floodwaters in 1977 and 2004. Reinforcement of the remaining facilities' perimeter defenses proved to be successful as no impact to the property was reported as a result of the August 17, 2021 flood.
After the rains finally ended, it was common to see entire basement contents put out in the sun to dry even at homes in neighborhoods well above any risk of stream flooding. There was so much rain at our home in Candler, torrents of runoff flowed downslope across our and our neighbor's backyards, so it looked like we had several small creeks running on all sides of our house; not good because our house is 60 feet in elevation above the nearest actual creek. One of the "streams" rose high enough to infiltrate a vulnerable corner and flood our basement. In addition, a downspout drainage pipe backed up causing water to infiltrate a 2nd corner of the basement. I did what I could in an ongoing deluge to redirect outside runoff away from the house. After Chrissy arrived home from work to utter chaos, we spent the next 6 hours moving stuff to isolated higher areas of the floor that had remained dry and sucking up water with an old Bissel carpet cleaner we keep around for just such an occasion; this was the third time our basement has flooded in 23 years, with the last about 15 years ago. I believed then I had properly engineered the outside perimeter of the house so it couldn't flood again, but obviously not a good enough job to stand up to what the weather service claimed was the most rain received in a 3-day period in 50 years. It took a couple weeks with a constantly running dehumidifier to get the basement back to some semblance of order. I've since refortified our defenses to prevent another basement flood even if we get more rain than the last devastating storm, but we'll see.
WEST FORK OF PIGEON RIVER
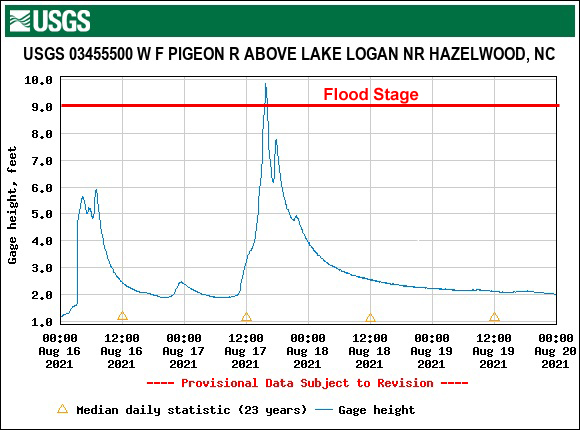
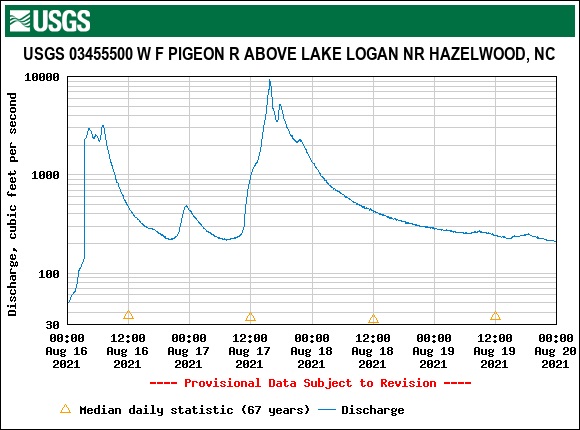
As a somewhat side note, the West Fork of the Pigeon River barely reached flood stage for a relatively short time as compared the East Fork, so its surrounding areas were not impacted by river flooding. This was likely because the West Fork drainage area is only about half that of the East Fork, its channel is generally broader and less topographically confined that the East Fork and Lake Logan in its path acts as a buffer to downstream flooding as its large area can contain excess stream flow.
West Fork of Pigeon River (10-17-21)
RAIN, EROSION, LANDSLIDES AND FLOODING
GRAVEYARD FIELDS AND YELLOWSTONE PRONG
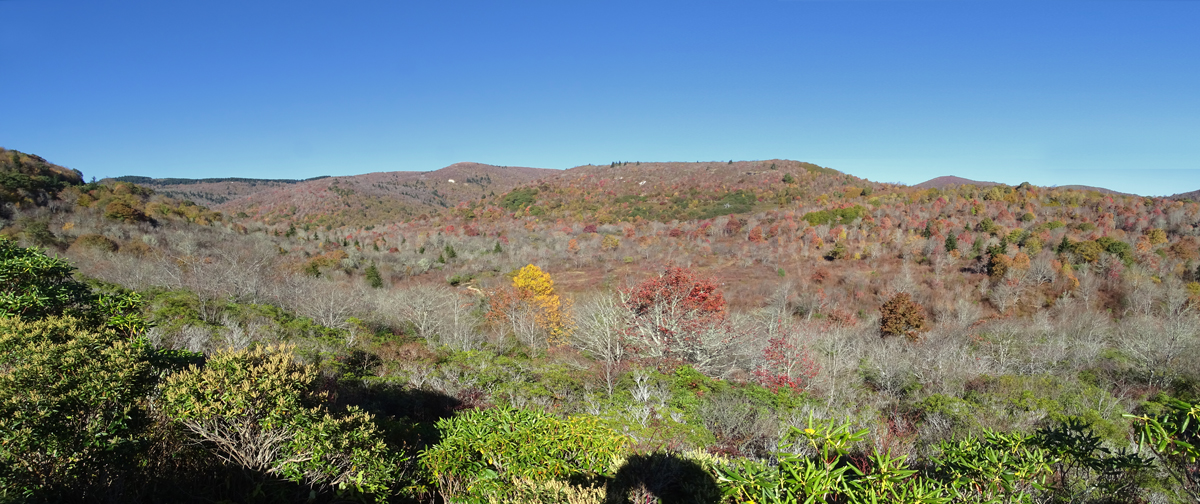
Graveyard Fields from the Blue Ridge Parkway Overlook (10-20-21)
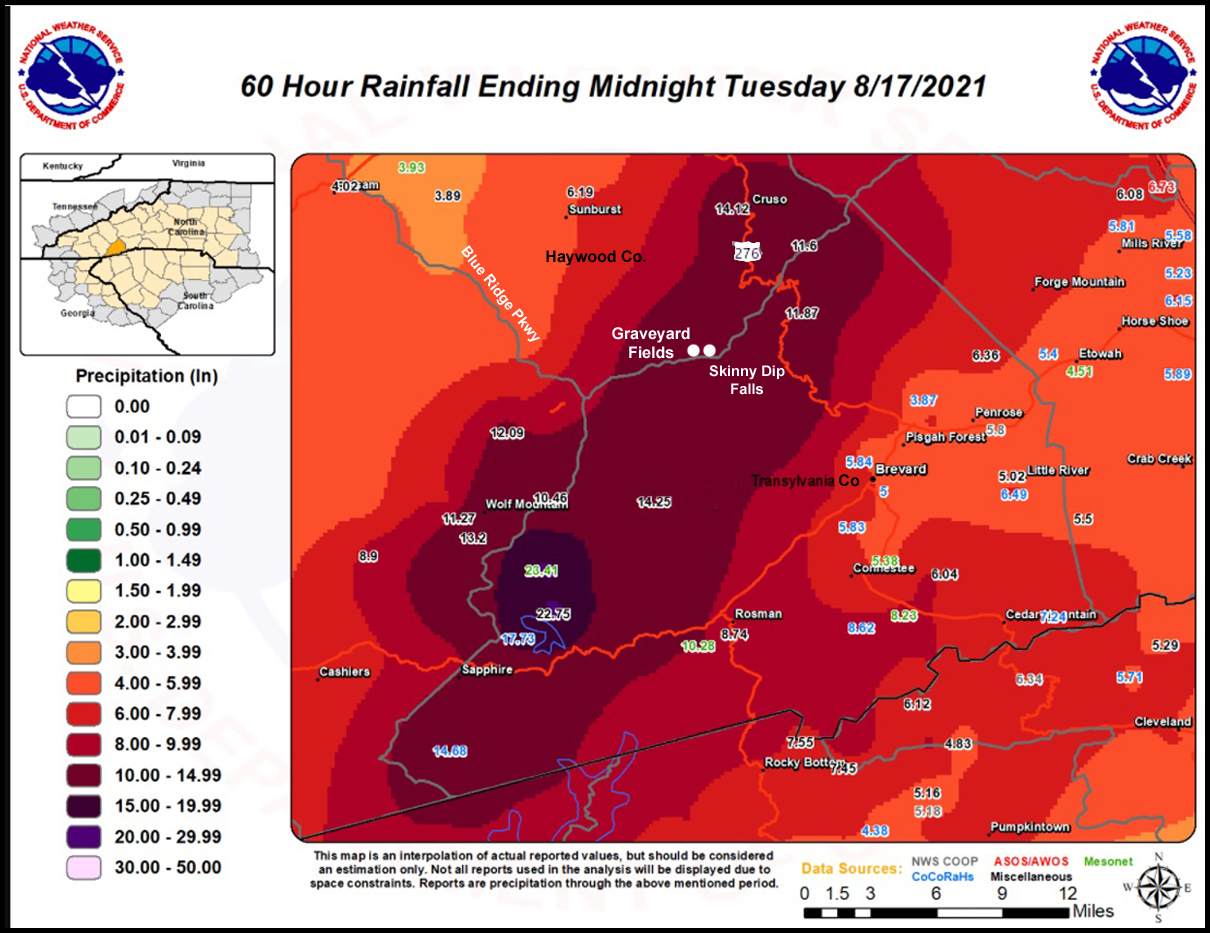
Estimates based on interpolation from actual reported values indicate the Graveyard Fields and Yellowstone Prong area received at least 14 inches of rain over a 60 hour period that ended August 17, 2021 at midnight. Based on actual reported rainfall totals up to 23.5 inches in the Black Balsam Mountains to the west, it is possible that Graveyard and Yellowstone received much more than what was estimated. Massive rainfall amounts in Graveyard Fields is demonstrated by extensive trail erosion and landslides as shown in the following pictures. 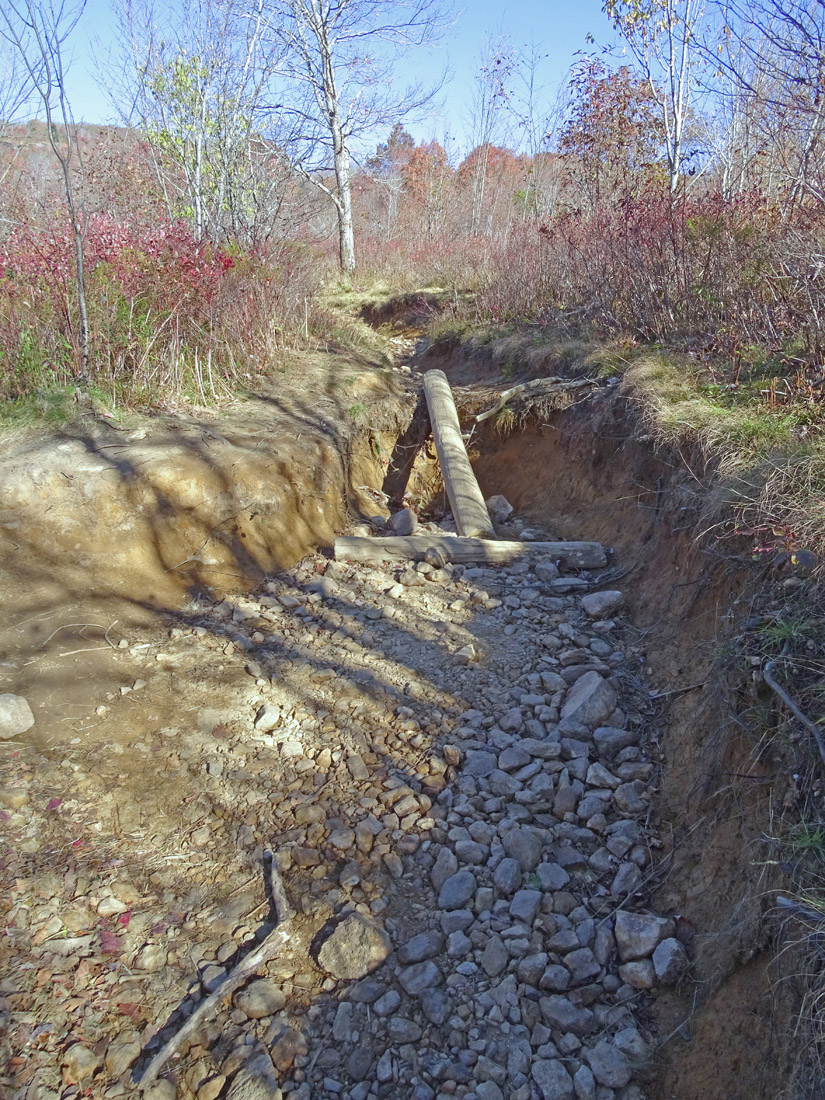
10-20-21
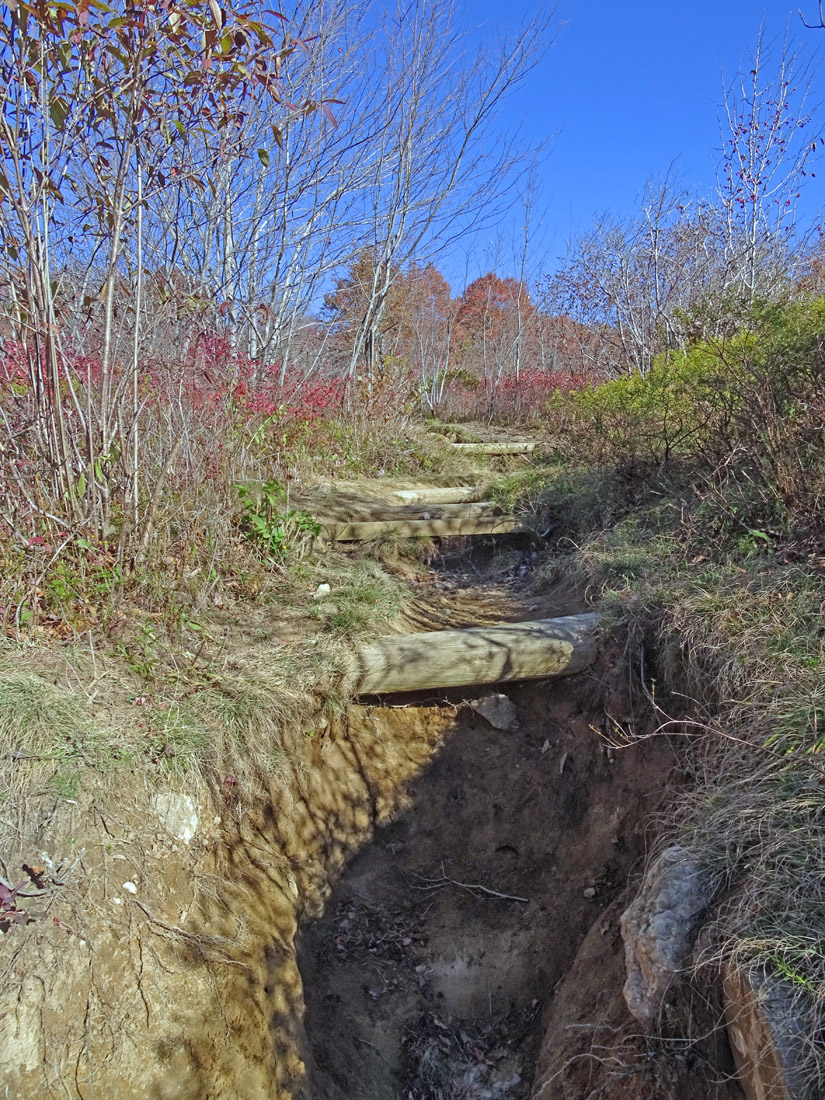
10-20-21
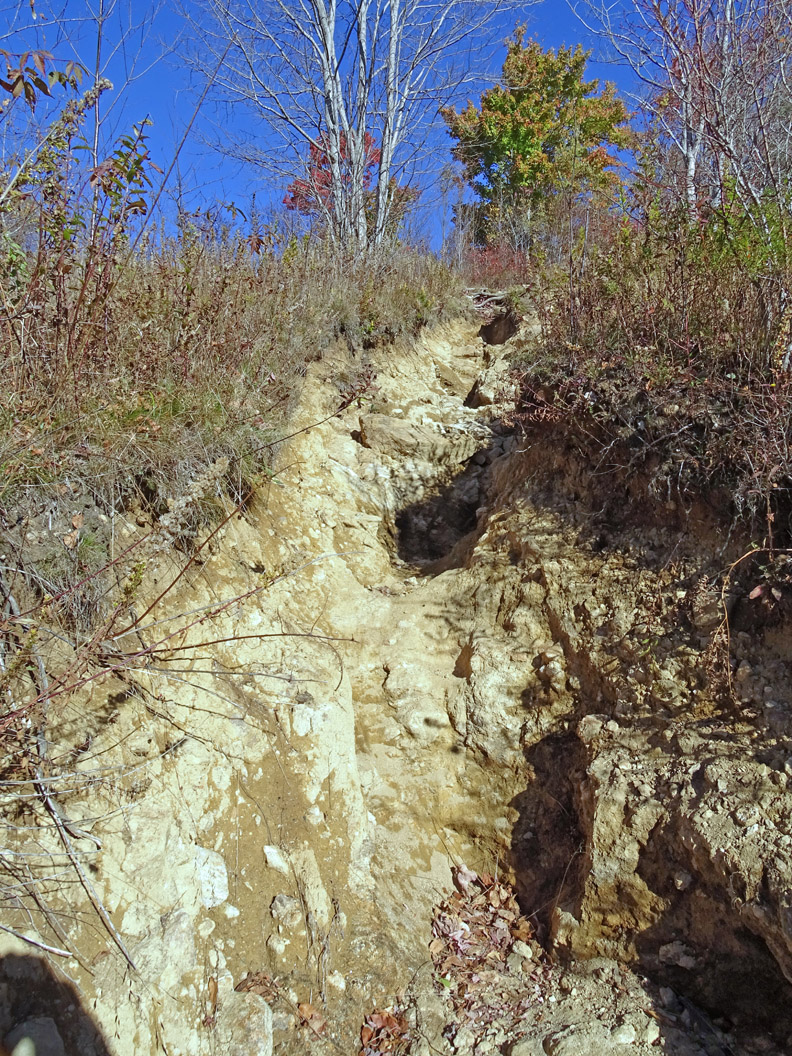
10-20-21
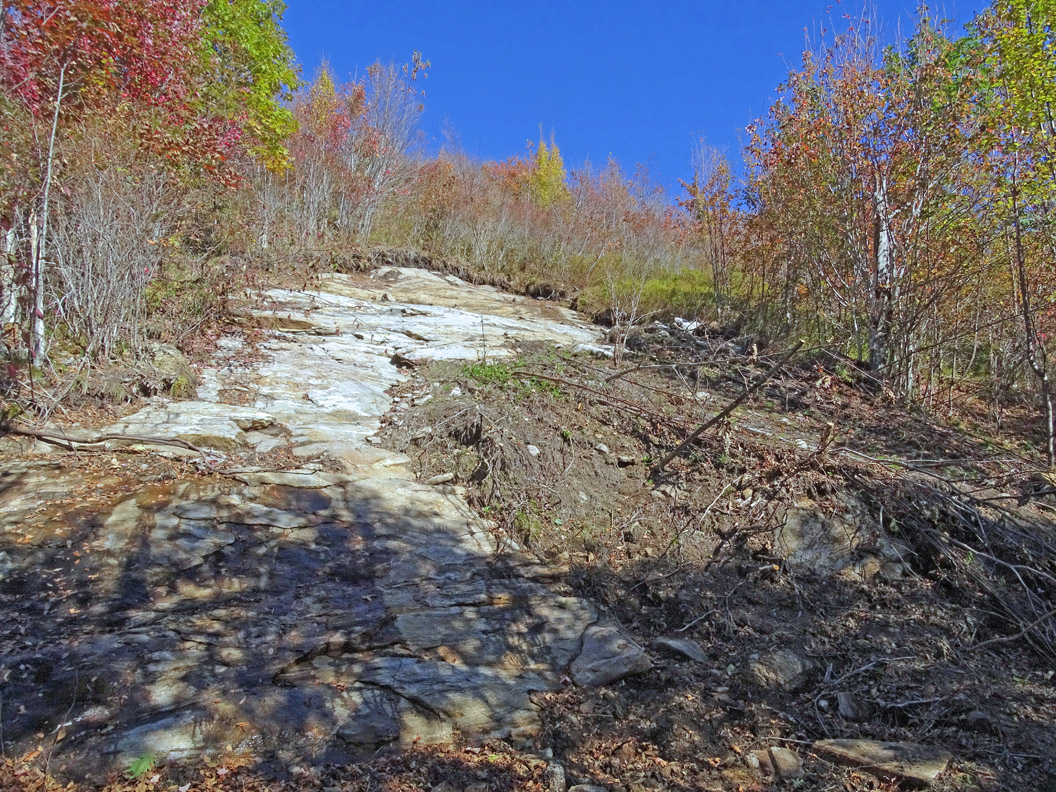
Translational landslide on bedrock above Graveyard Ridge Trail (10-20-21)
YELLOWSTONE PRONG LANDFORMS AND GEOLOGY
I returned to the Yellowstone Falls to Skinny Dips Falls section of Yellowstone Prong September 13 & 29 and October 9, 2021 to study the landforms and geology. I tracked my September 29th route with an eTrex 30 GPS unit and collected GPS coordinates and recorded written observations for noteworthy features.
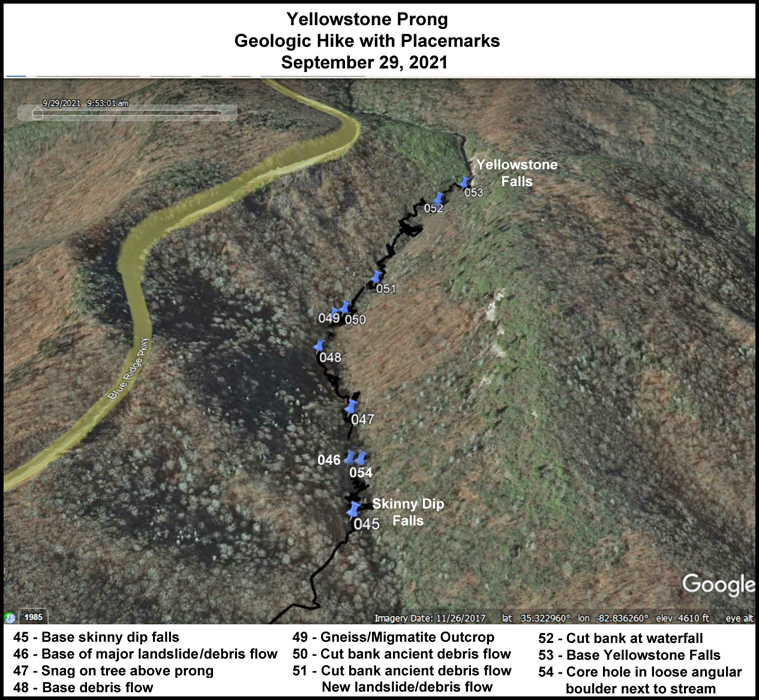
I also captured many additional pictures along the way for future study. What follows are the pictures with descriptions, observations, speculations, conclusions, and other comments. 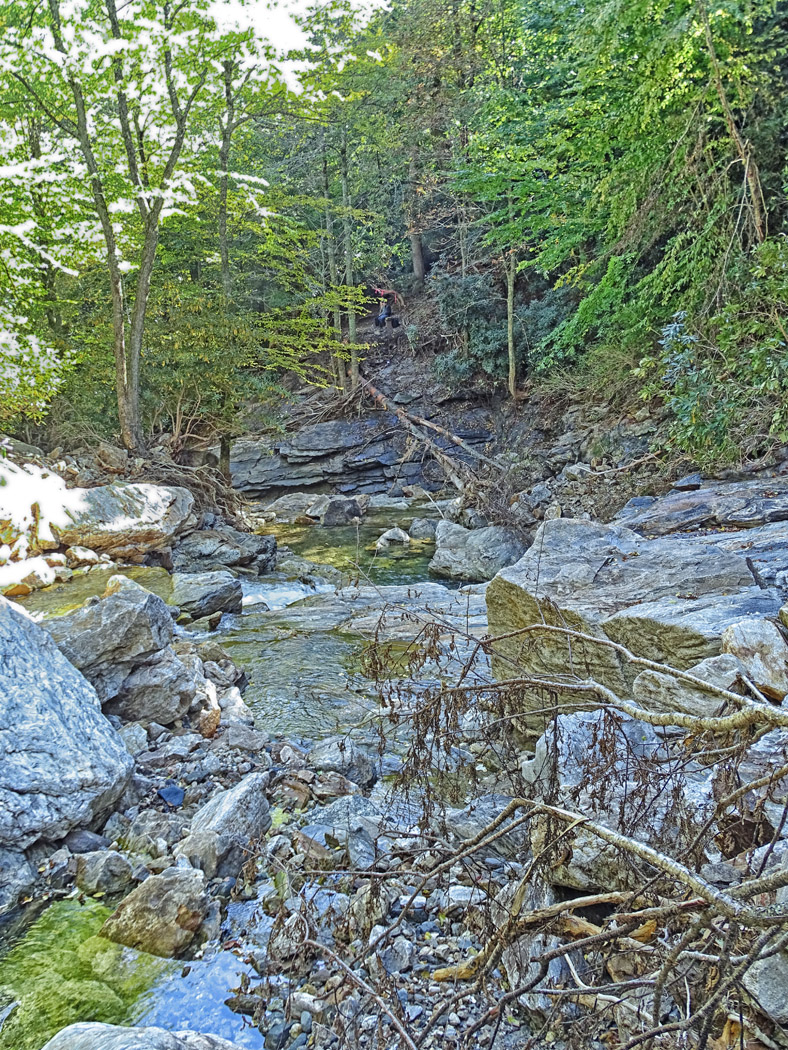
(9-29-21)
The above picture shows the area just below Skinny Dip Falls. The stairs once led from the upper middle of the picture (where two people are sitting) to a bridge over the creek that would be out of sight to the middle left if it still existed. The large tree and other debris high on the bedrock outcropping demonstrates the floodwater reached as much as 15 feet above the average low water level.
Location of former bridge over prong. (10-9-21)
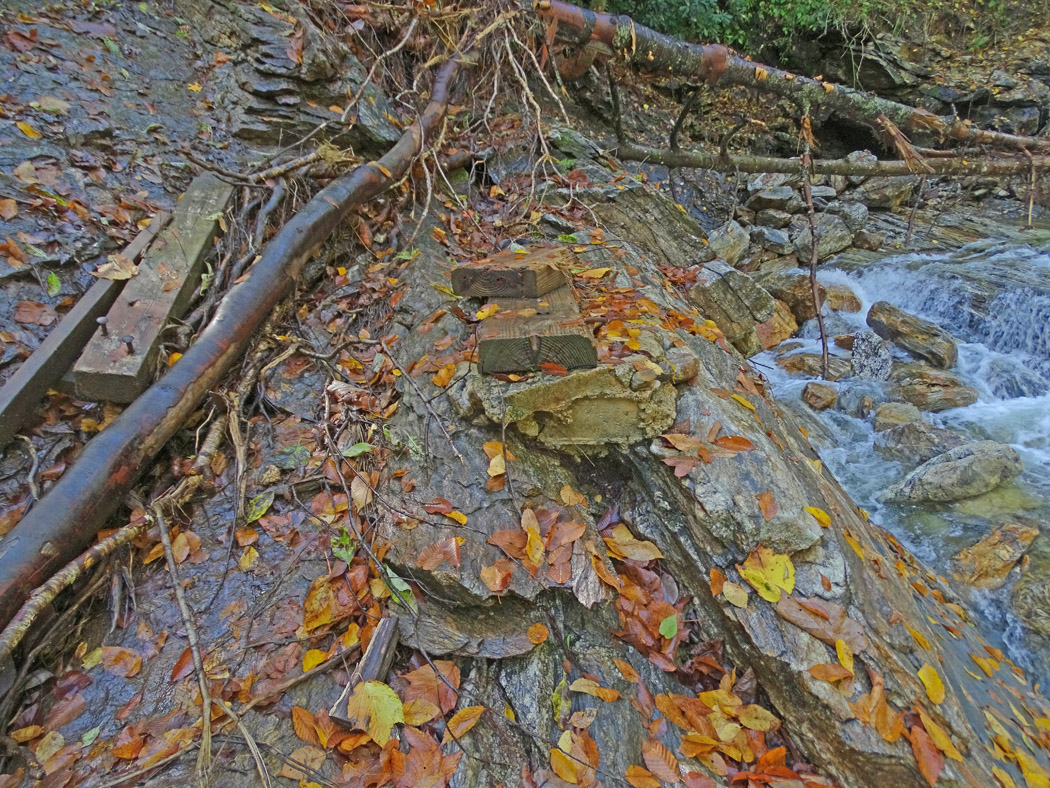 < <
Remains of former south bank bridge attachment on bedrock. (10-9-21)
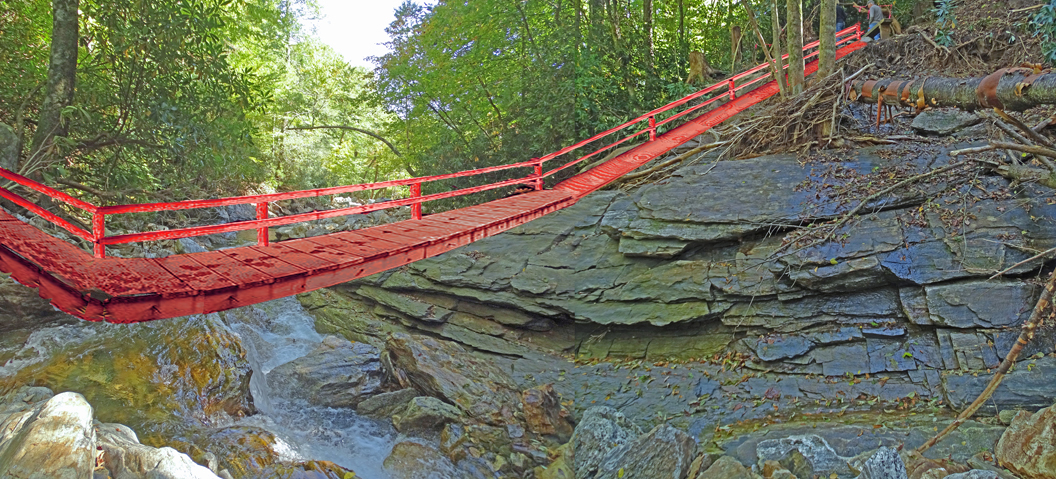
Above: Illustration showing former bridge approximate location. The rocks and soil that once supported the left side of the former bridge no longer exist having been washed away by the flood. (9-29-21)
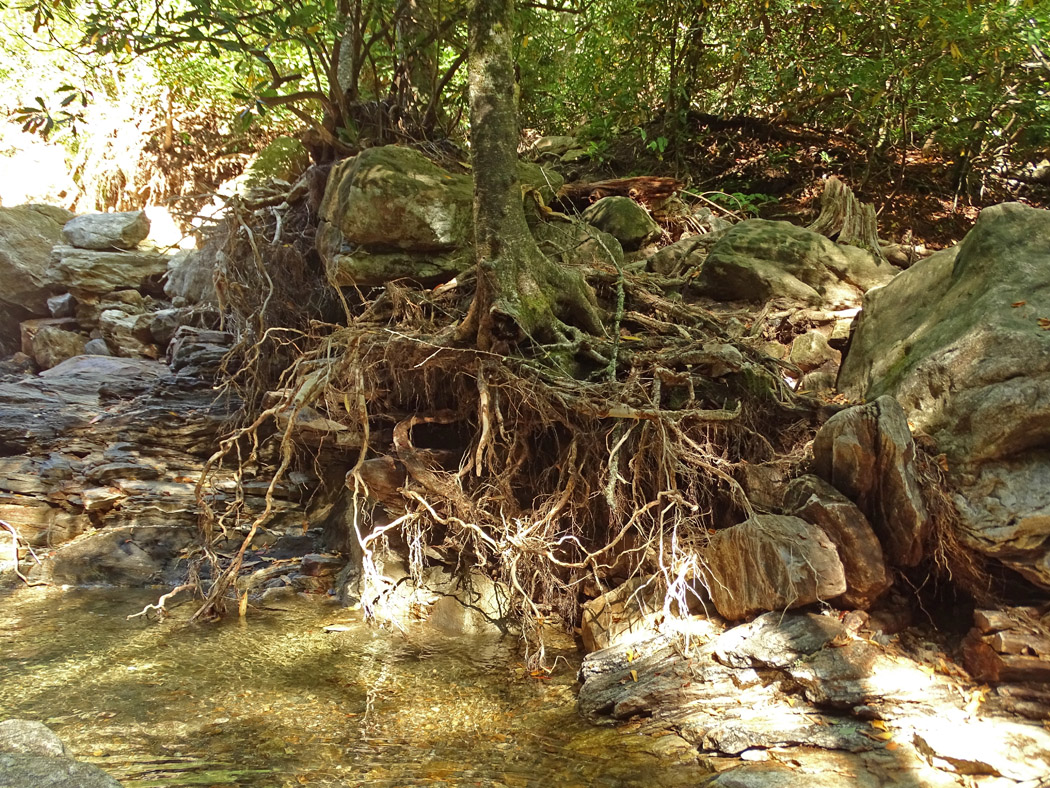
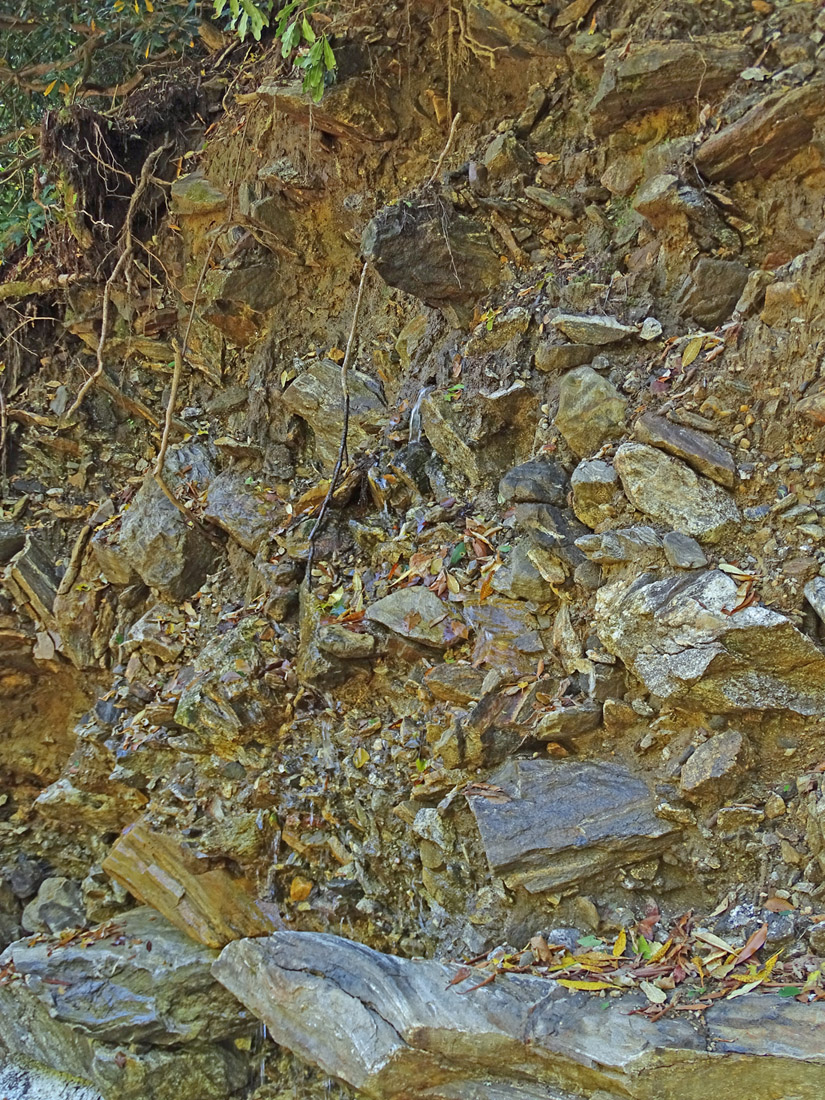
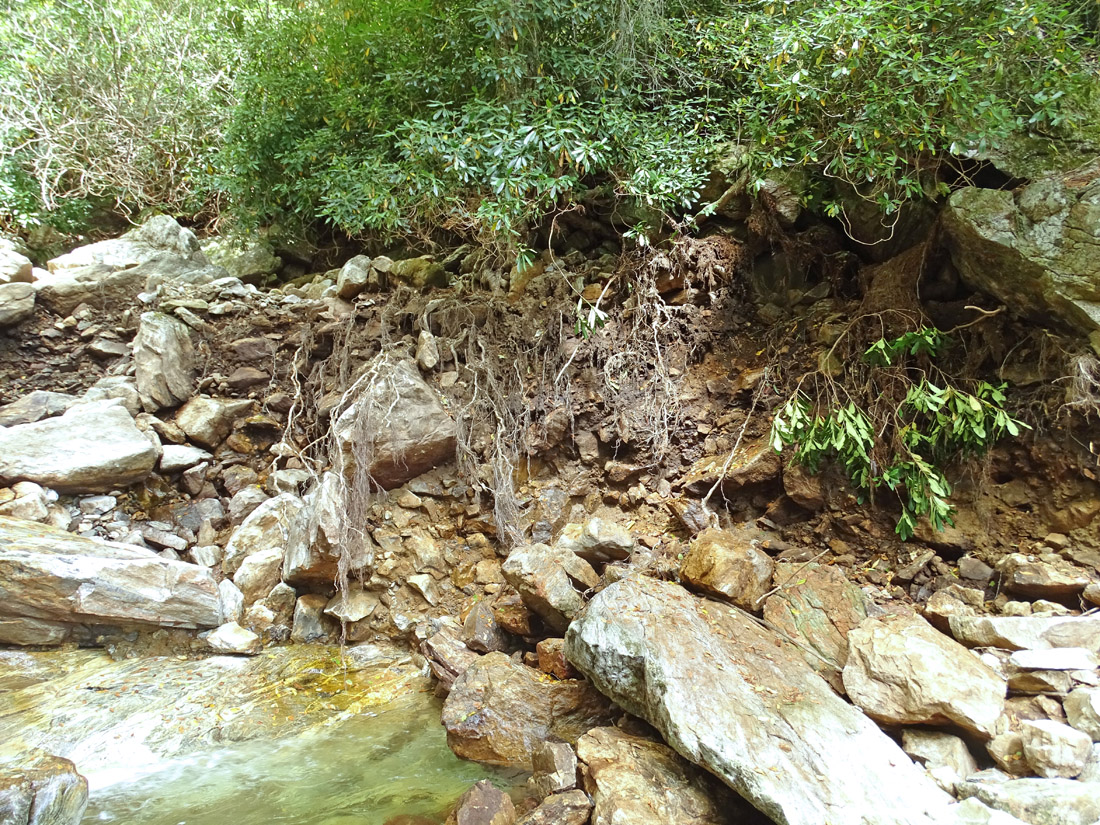
Tree roots left hanging over the prong due to removal of rocks and soil. (9-29-21)
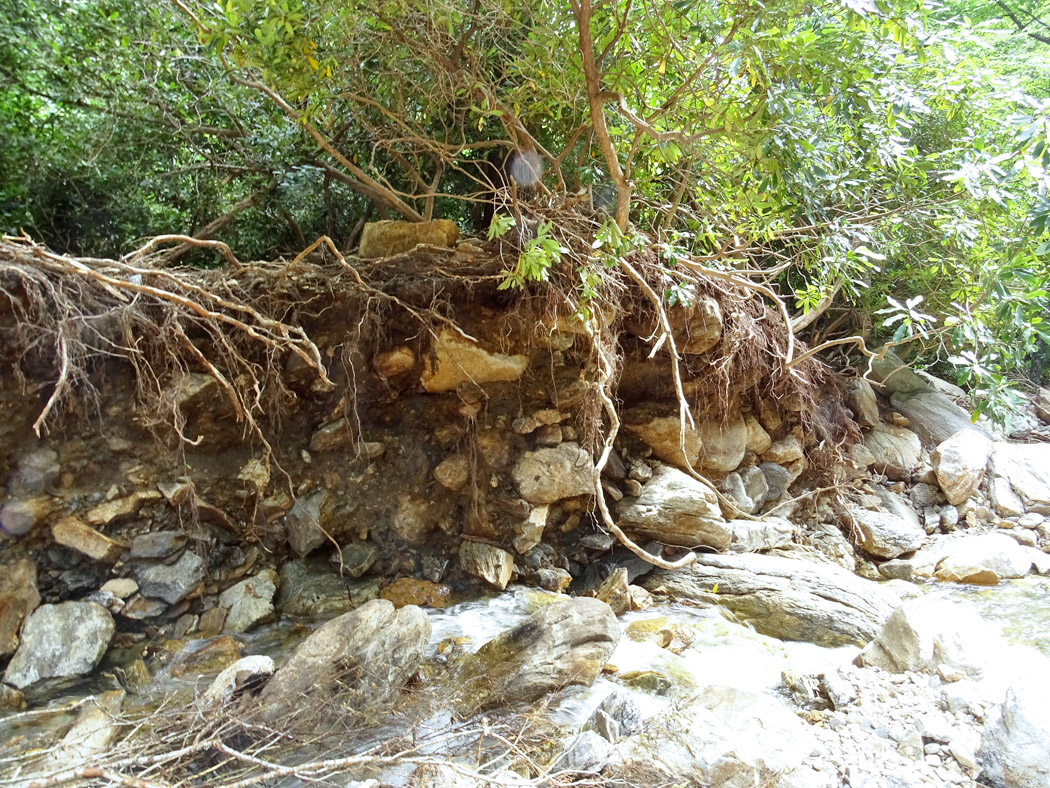
Erosional cut bank showing ancient river deposit characterized by rounded rocks. (9-9-21)
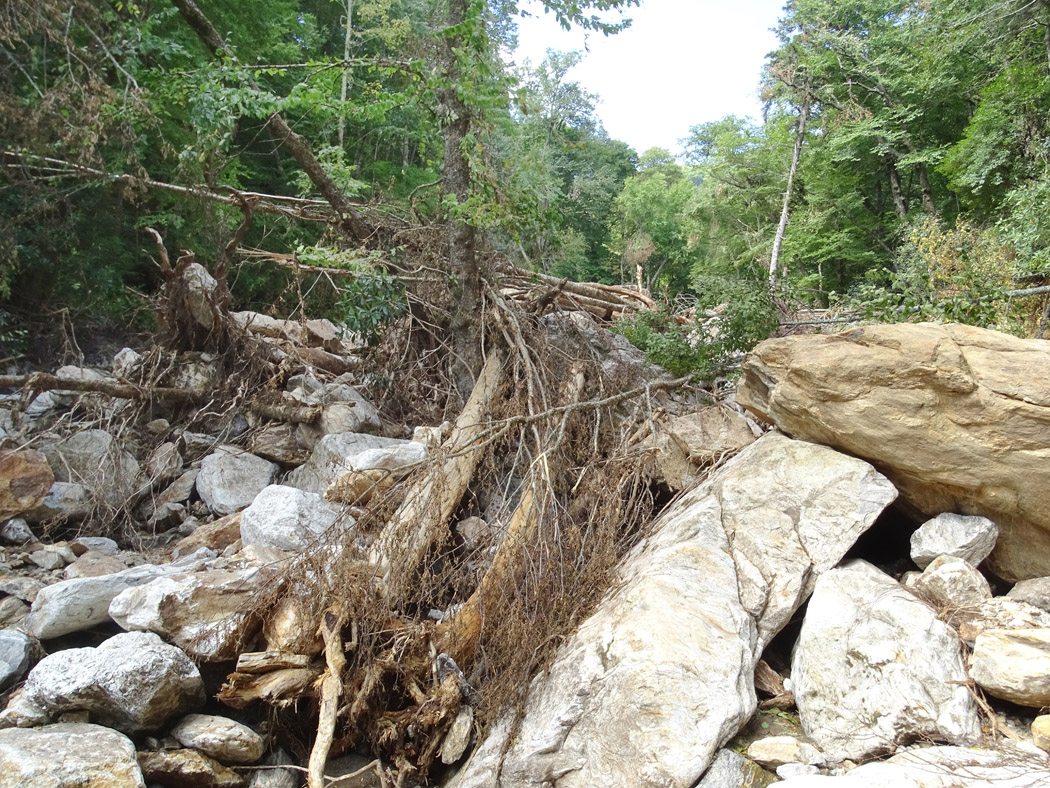
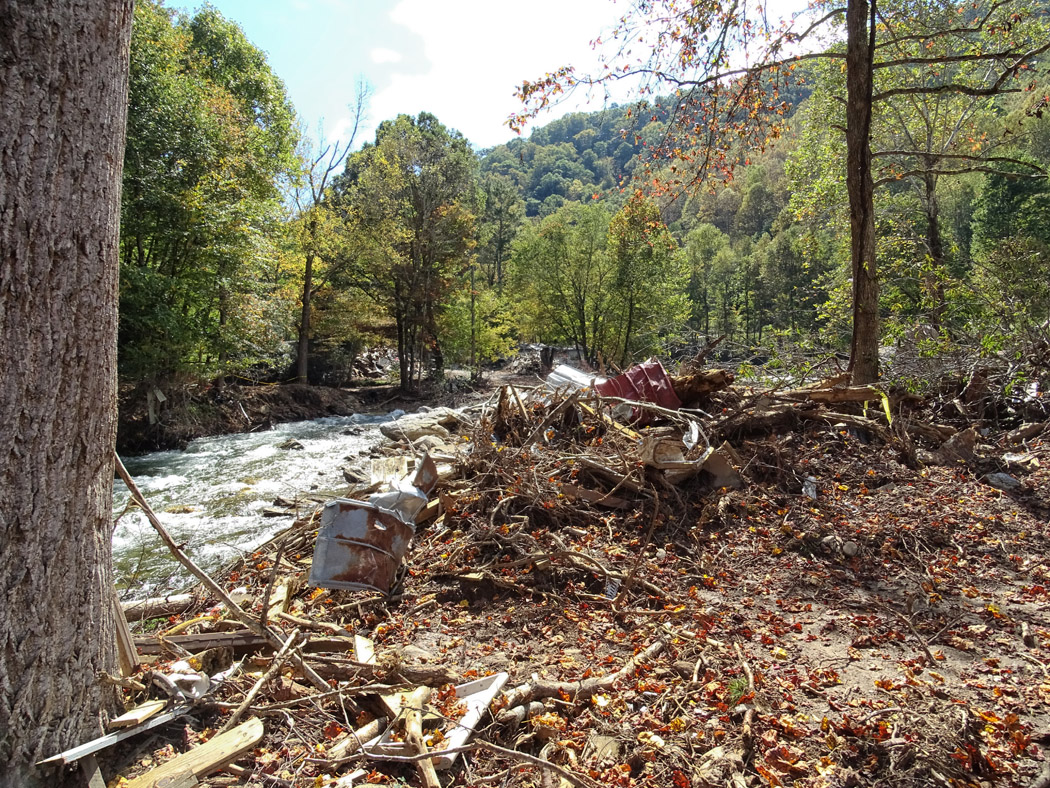
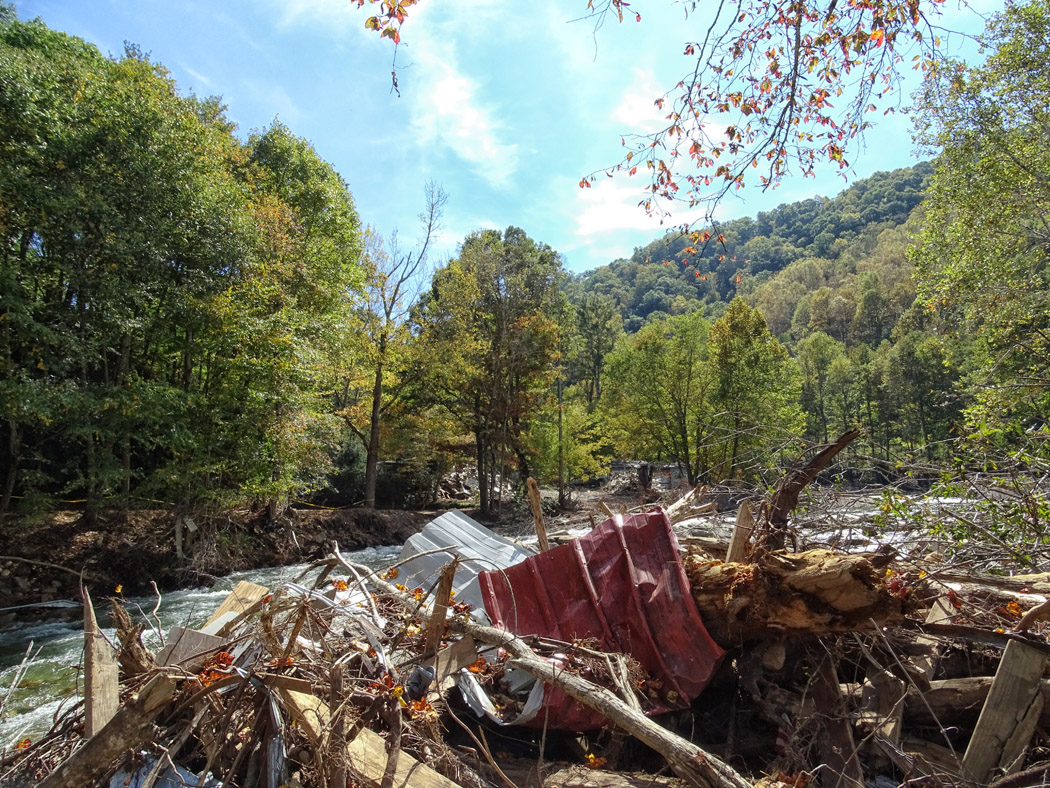
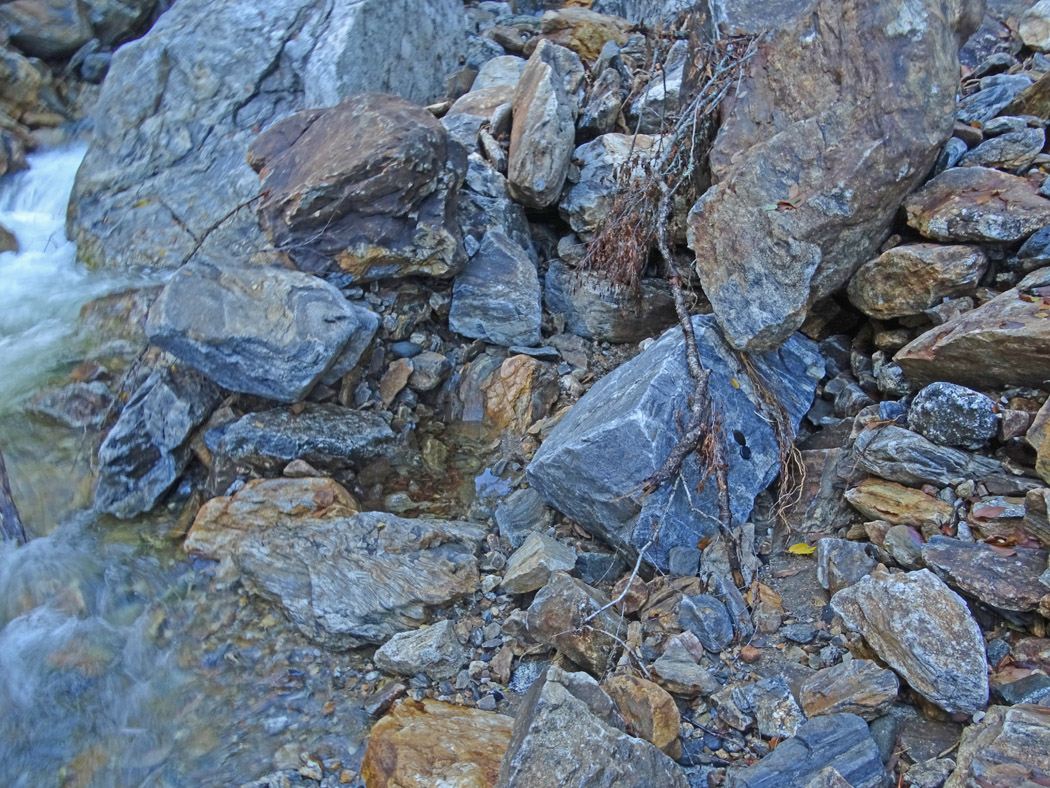
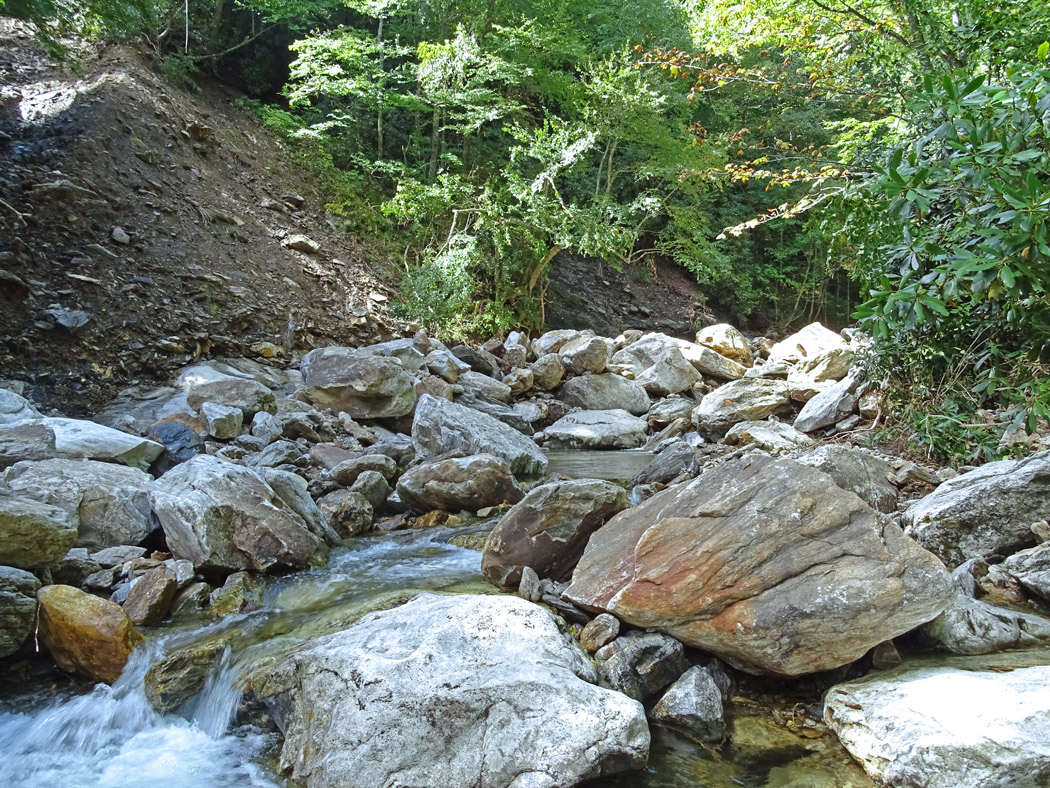
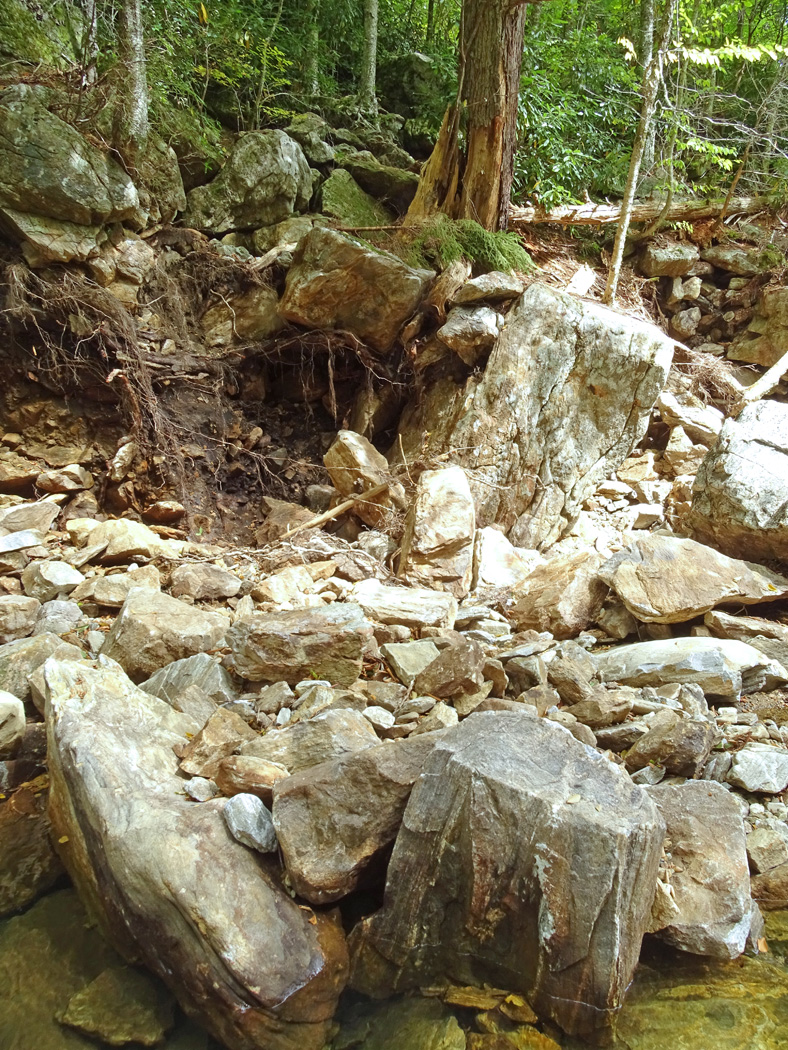
Boulders, trees and other debris transported and deposited by the flood at former Skinny Dip Falls. (9-9-21)
9-9-21
The above picture shows a cut bank on the north side of the prong of what appears to be a hybrid of a stream deposit and an ancient debris flow. Angular unsorted rocks in the left suggest a debris flow while partially rounded rocks and graded bedding may be indicative of a stream channel deposit. The underlying schistose bedrock appears to have been scoured either by a previous flash flood or debris flow. The ancient debris flows and stream channel deposits are intermixed and therefore difficult to distinguish.
9-9-21
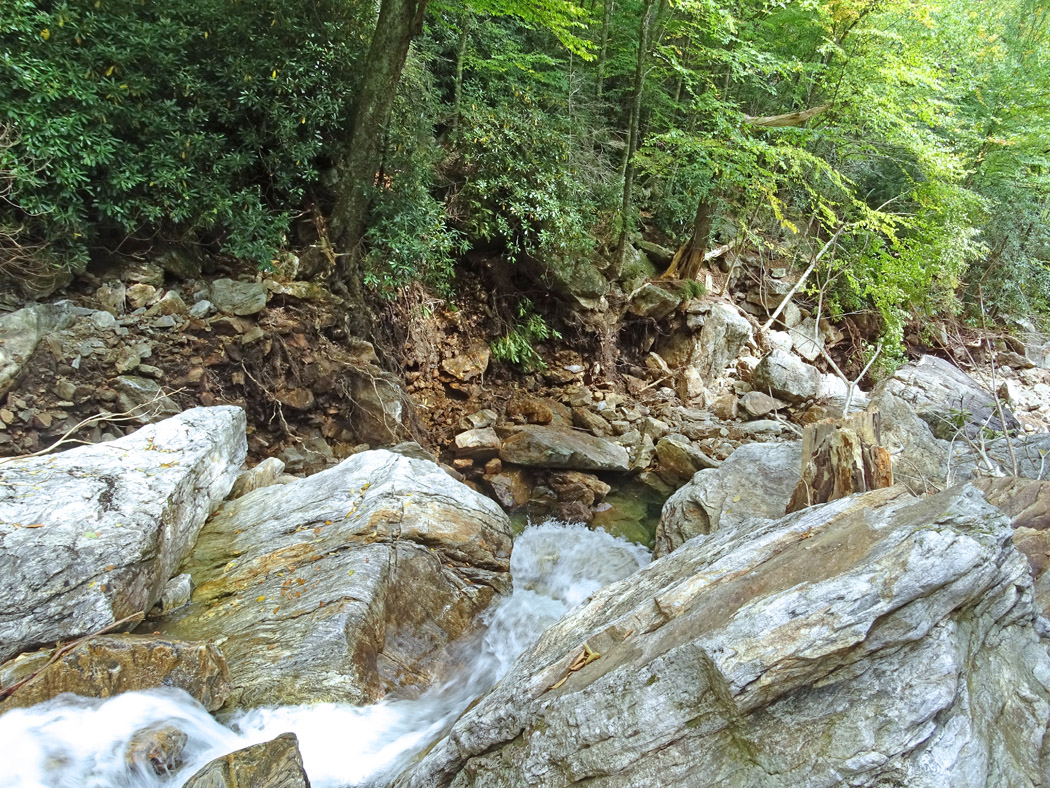
The above picture shows boulders, trees and other debris transported and deposited by the flood. A debris flow and associated landslide appear to the left.
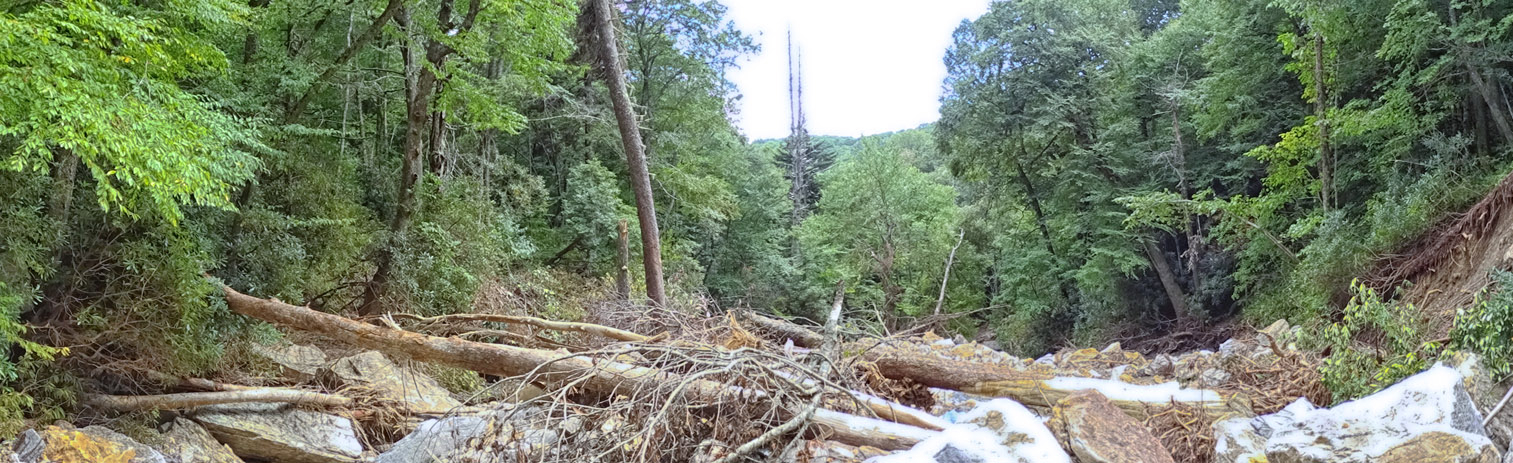
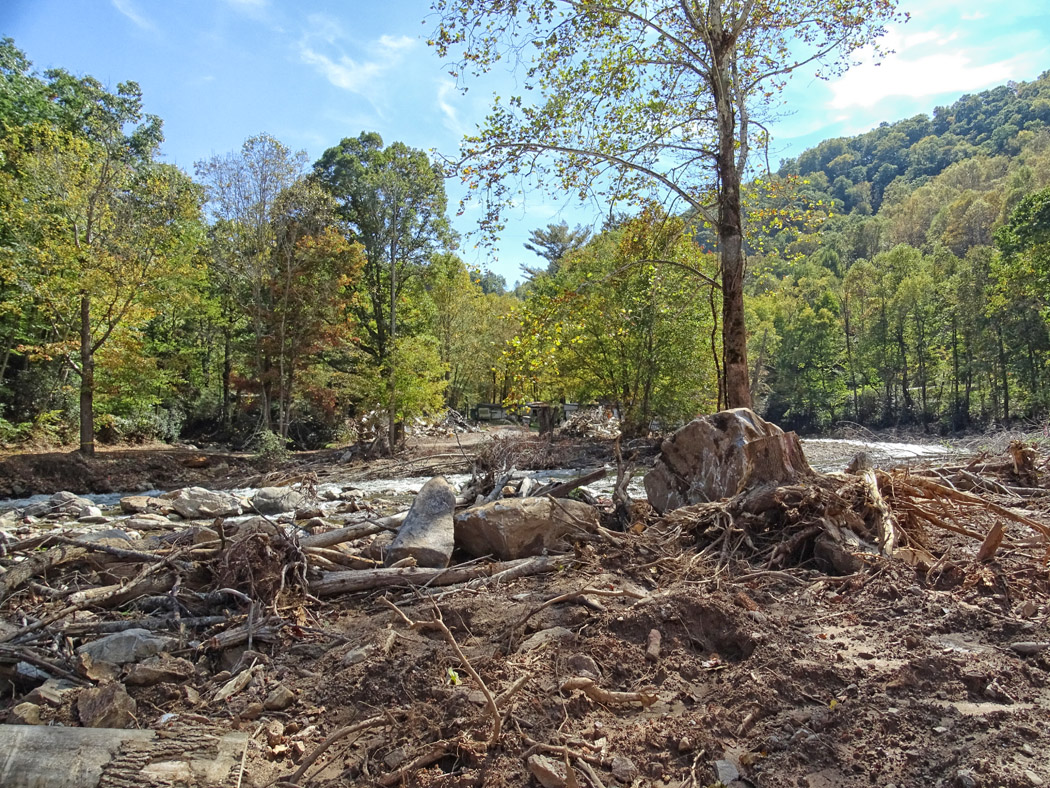
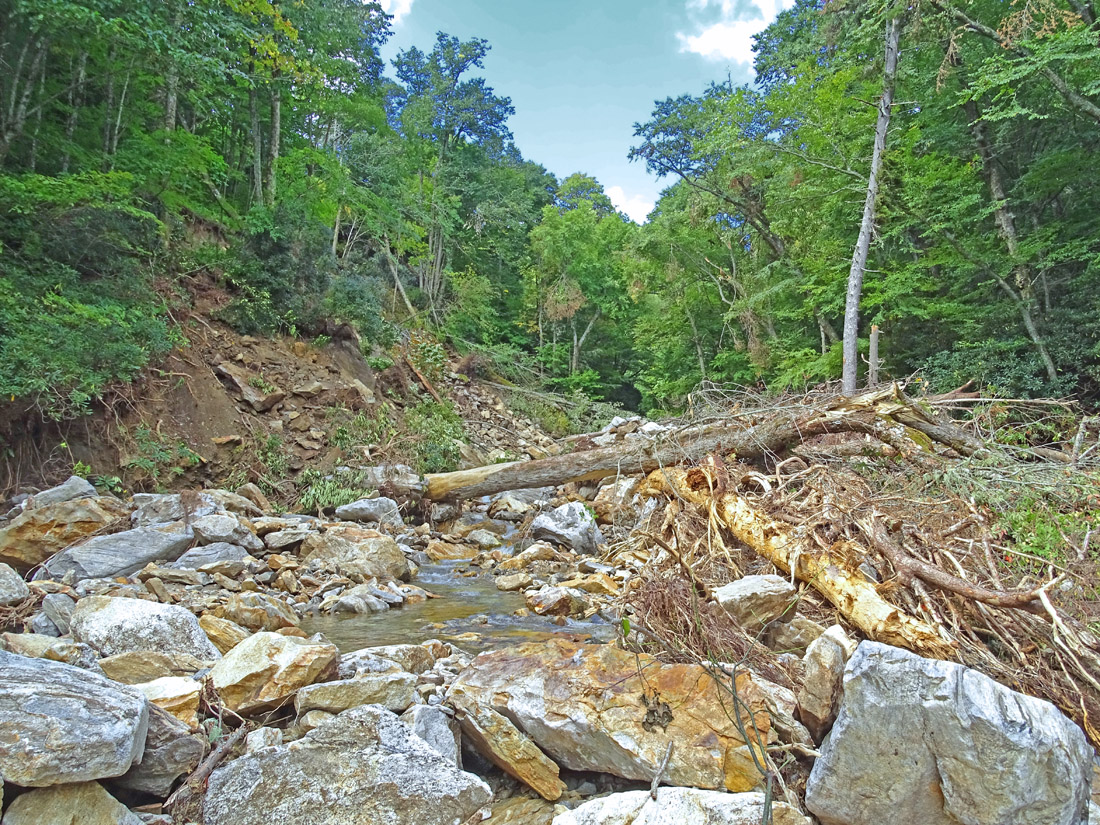
Downstream panoramic view of boulders, trees and other debris (9-9-21).
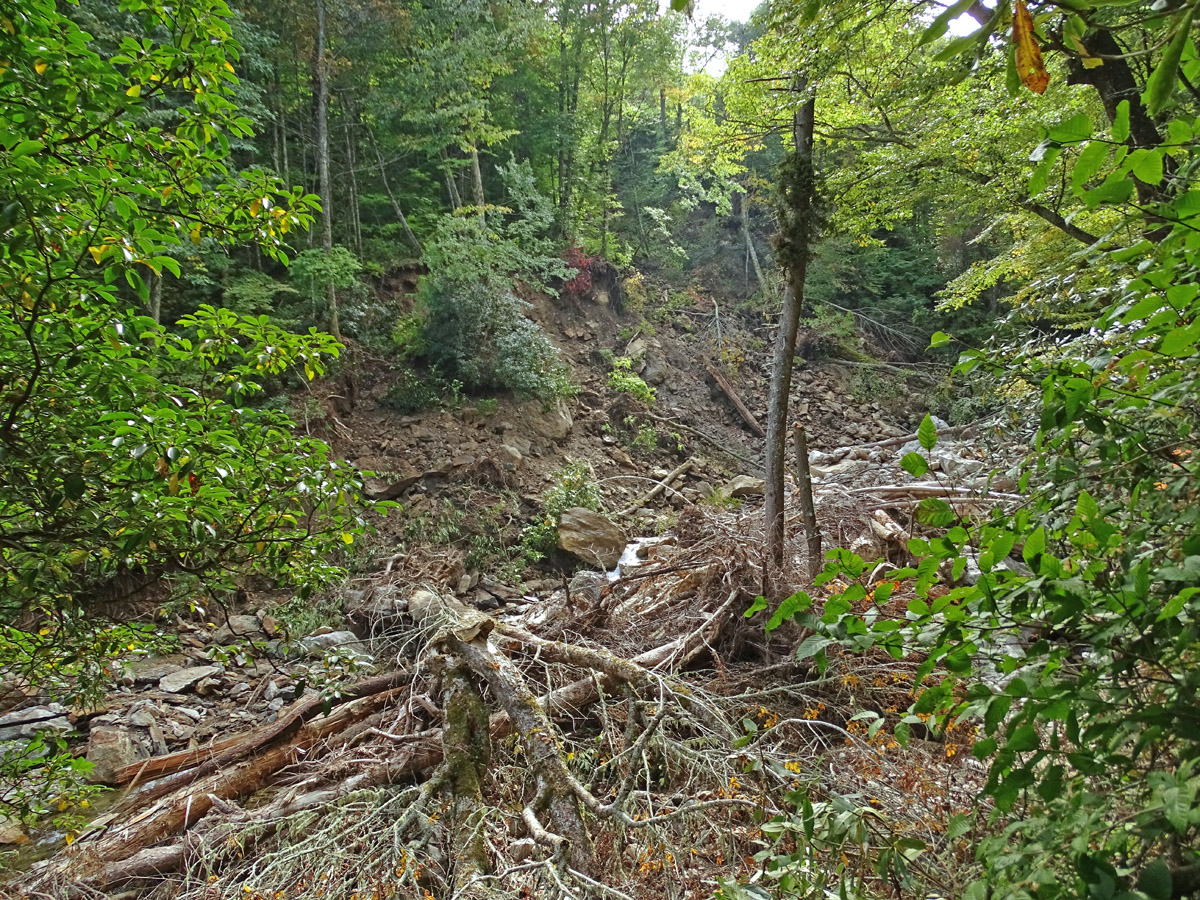
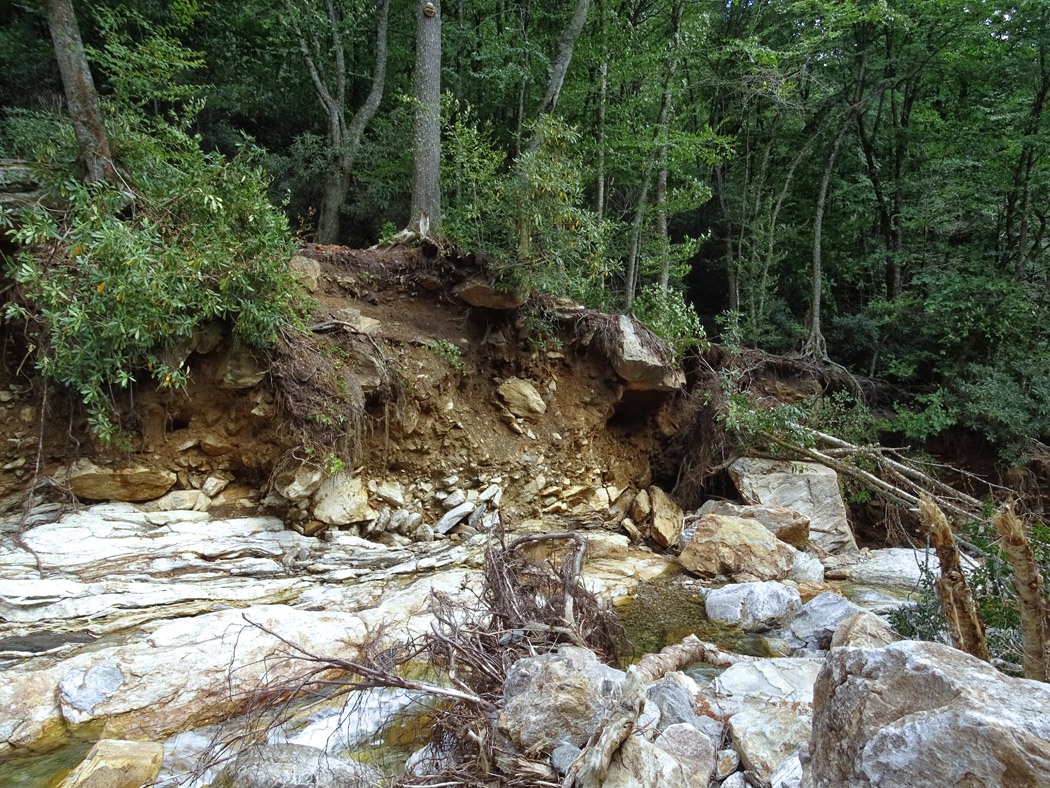
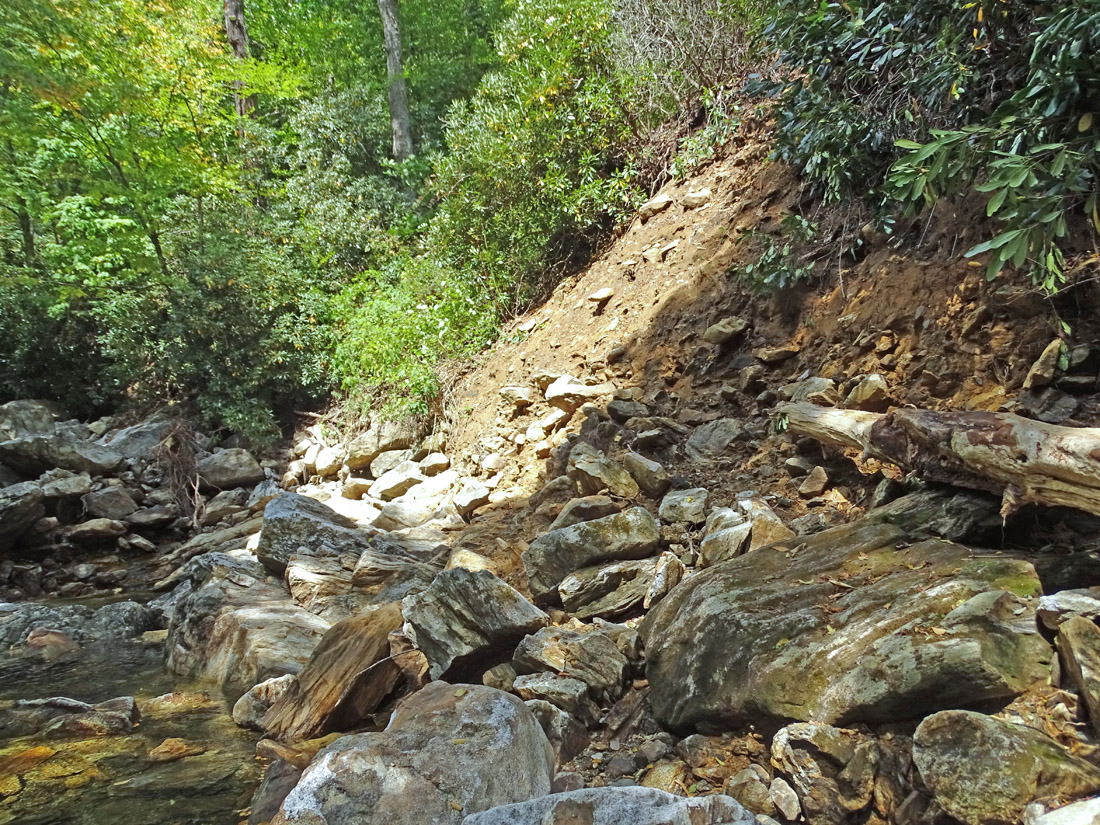
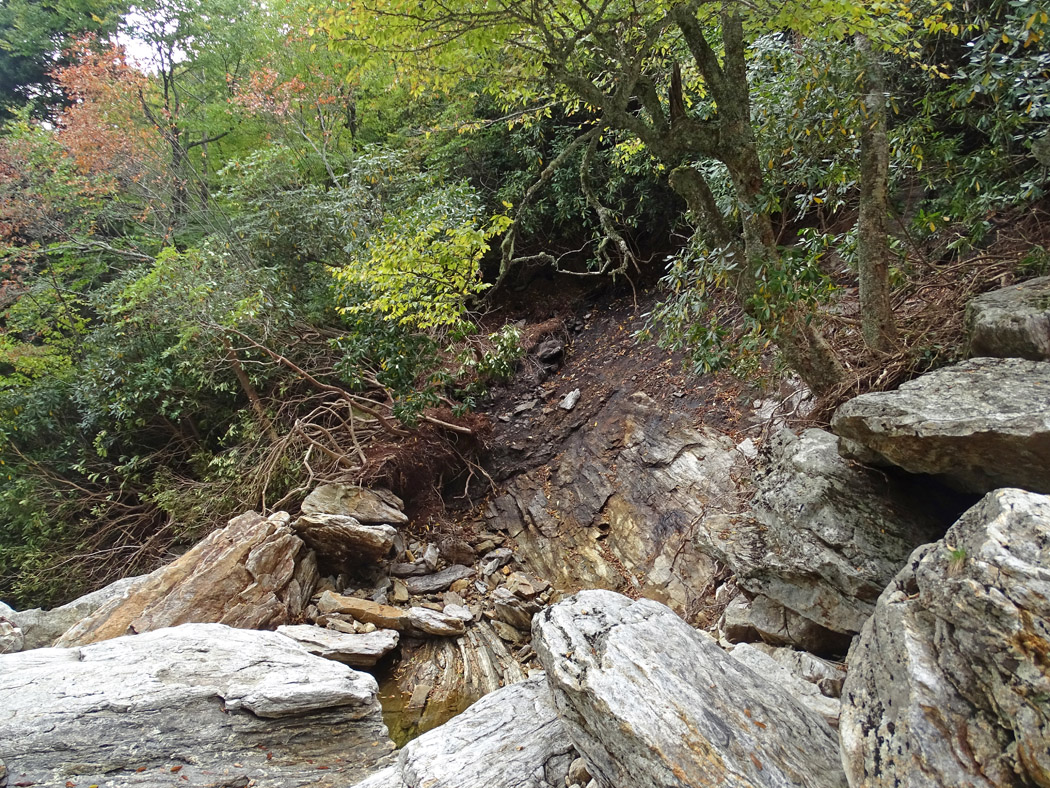
Landslide truncated by a debris flow on south side of prong (9-29-21)
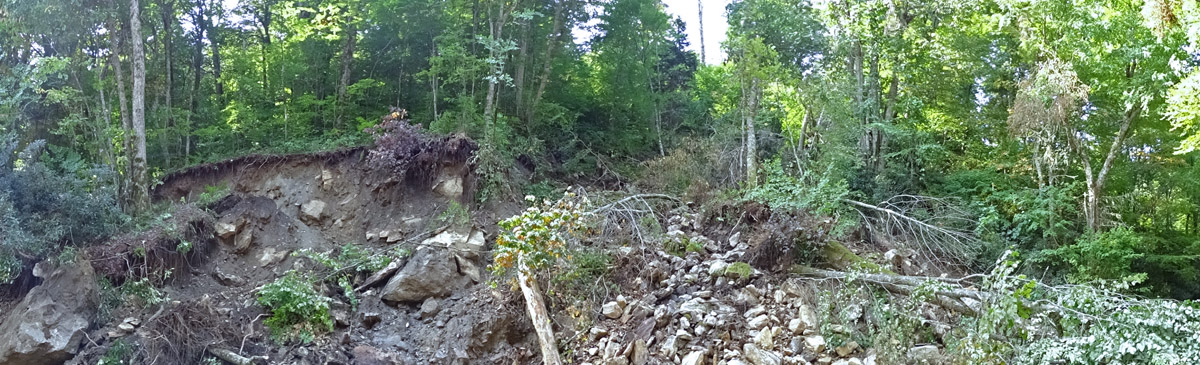
Panoramic view of landslide and debris flow on south side of prong (9-13-21)
9-9-21
The above picture of a landslide and debris flow on the south side of the prong appears to demonstrate the following: 1) A translational or perhaps rotational landslide consisting in part of ancient debris flow material took place above the prong. This was likely in response to the slope being undercut by the force of a flash flood; 2) A new debris flow that truncates the landslide occurred. Since the base of the debris flow does not appear to have been impacted by the flash flood, it likely took place after the stream level returned to its near normal level.
10-9-21
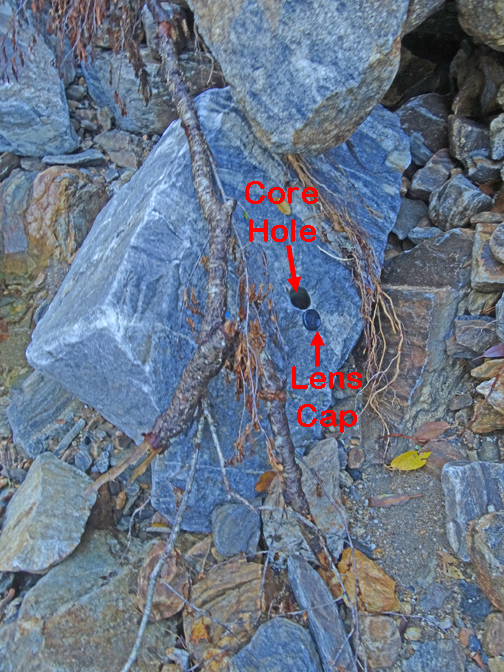
10-9-21
The above two pictures show a bore hole in an angular boulder on the north edge of the stream. The Blue Ridge Parkway with a massive roadcut is about 1000 ft up a steep incline from where the drilled rock lies.
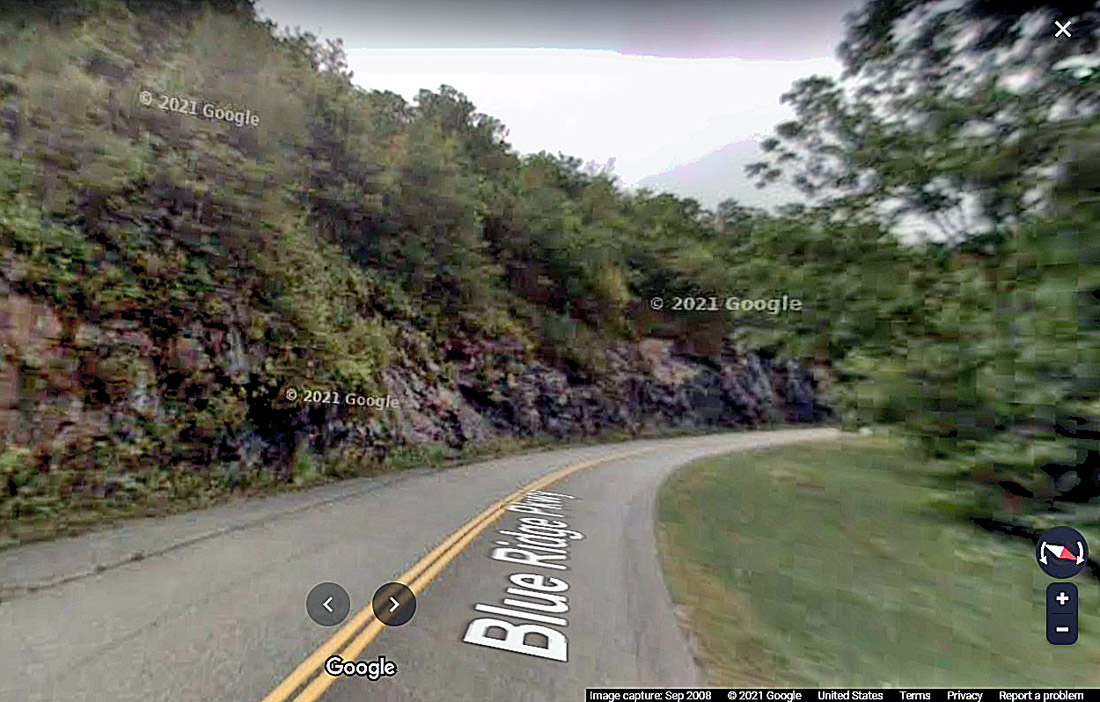
Google Earth street view of roadcut directly above landslide and debris flow
The most likely explanation for a borehole rock is that it is a remnant of bedrock blasting during construction of the Parkway in the early 1950s. The following historical pictures show actual construction of the Parkway in the area above or near where the rock with the borehole was found. (Picture source: https://docsouth.unc.edu/blueridgeparkway).
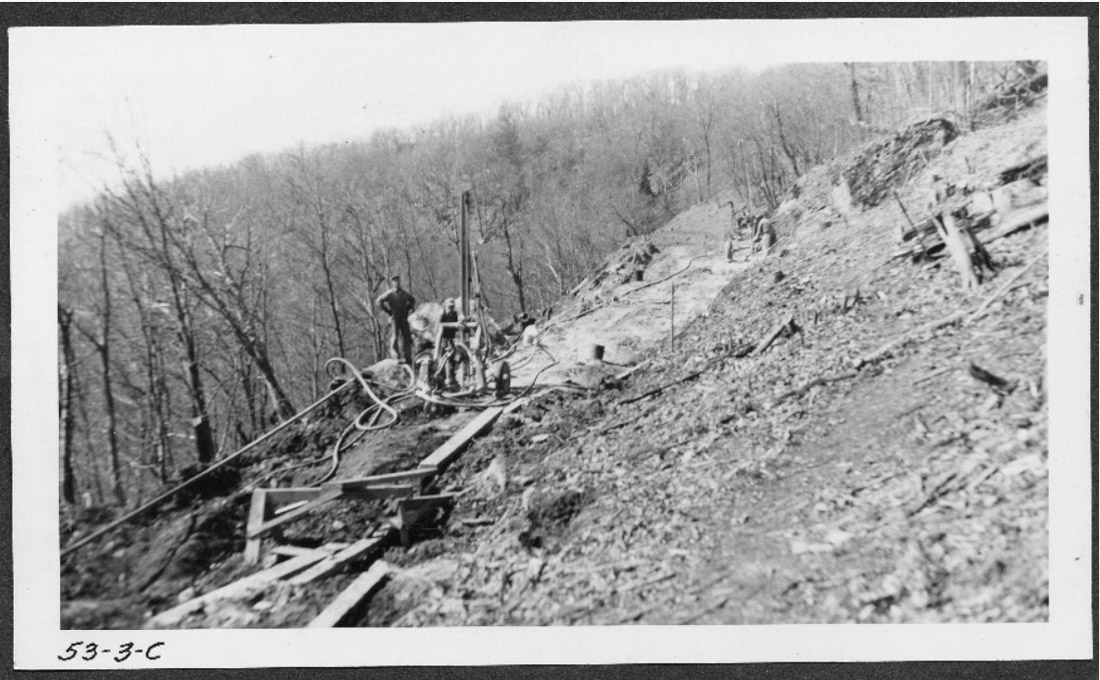
April 1953
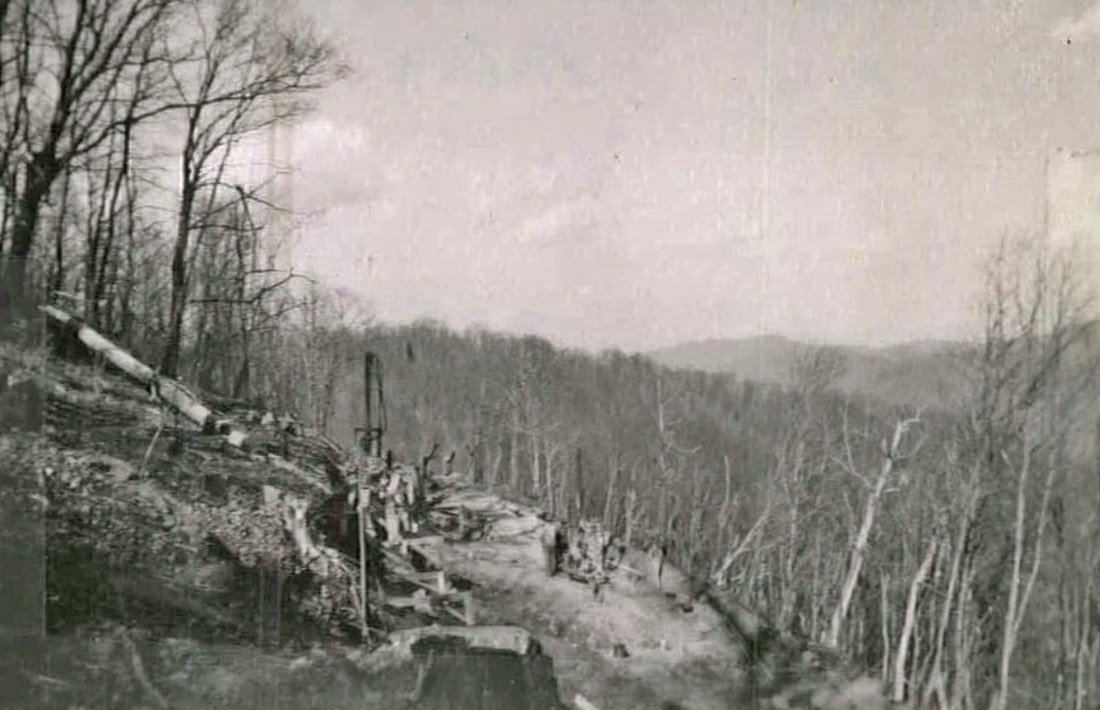
April 1953
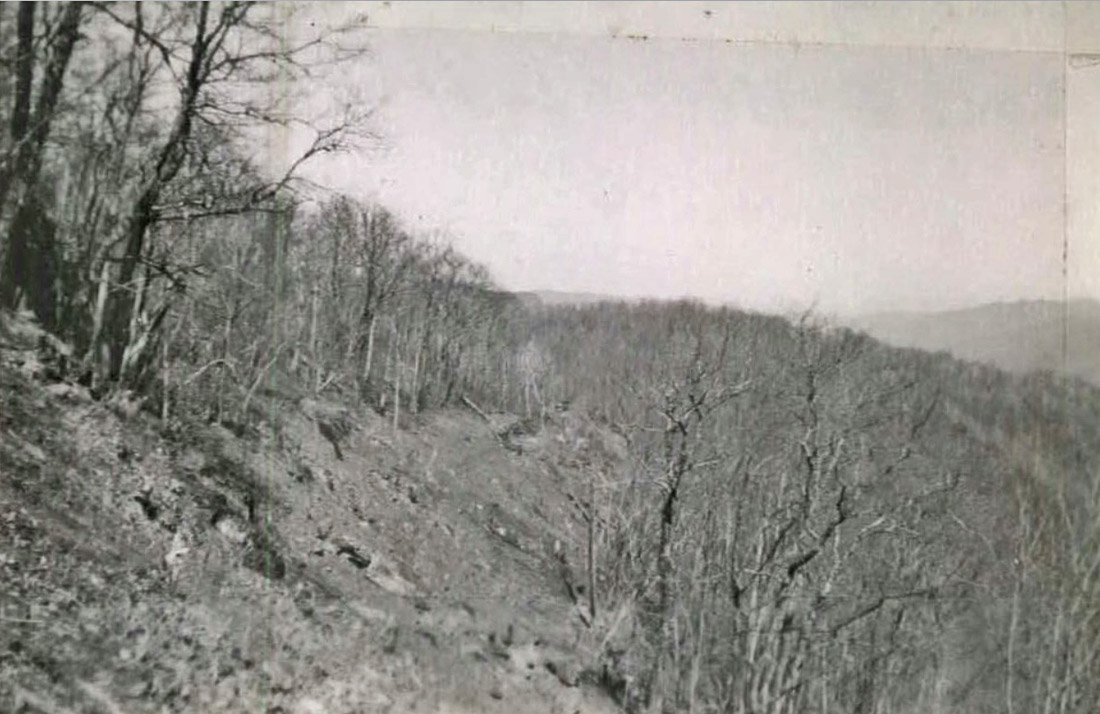
April 1953
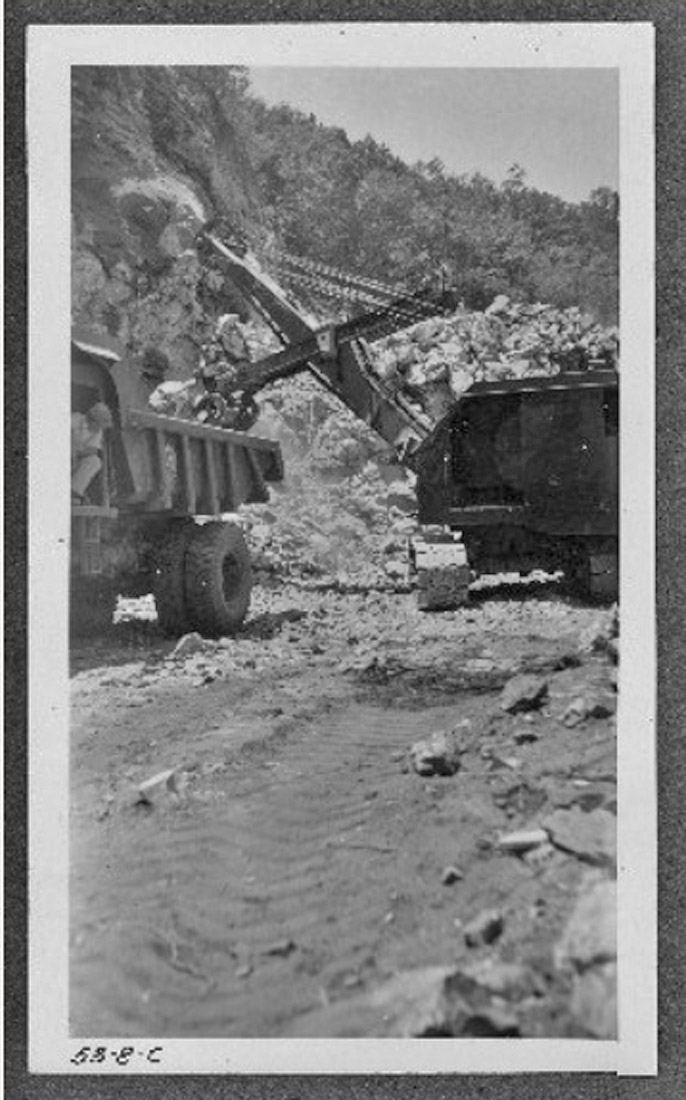
June 1953
A great volume of waste rock from construction was cast down the steep slope and this particular rock and many tons more made it all the way to the stream where they came to rest.
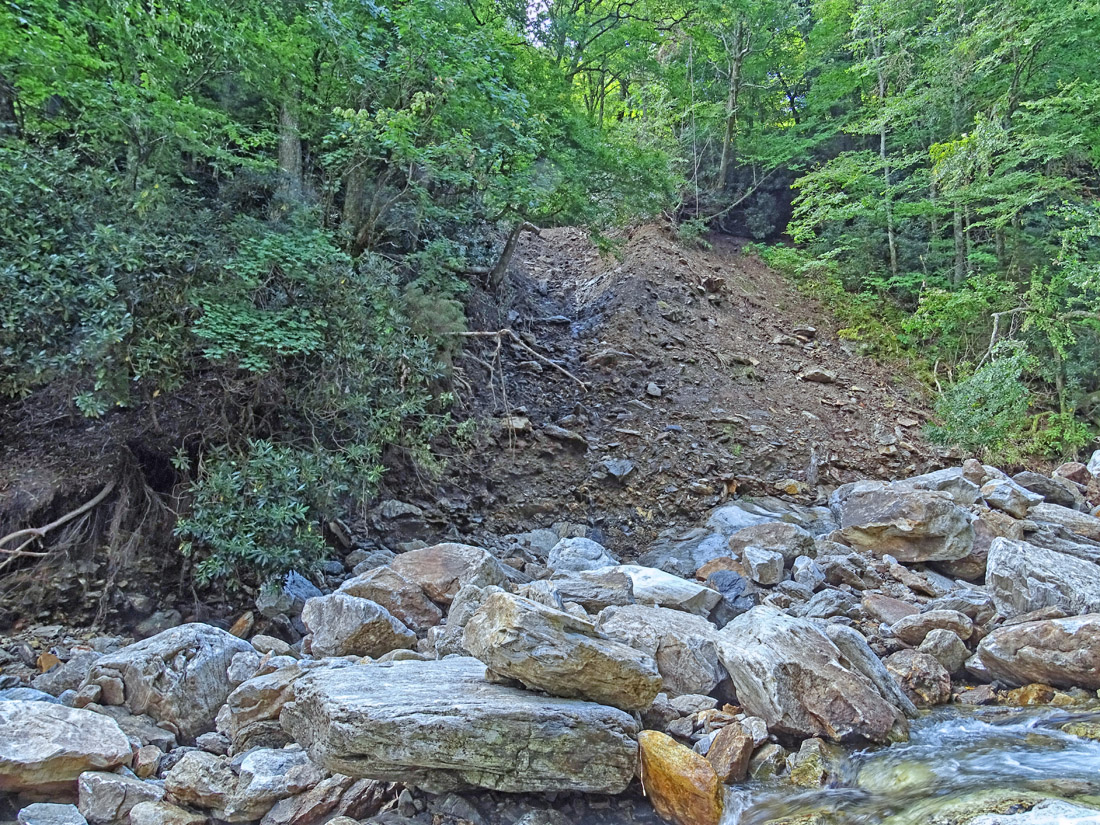
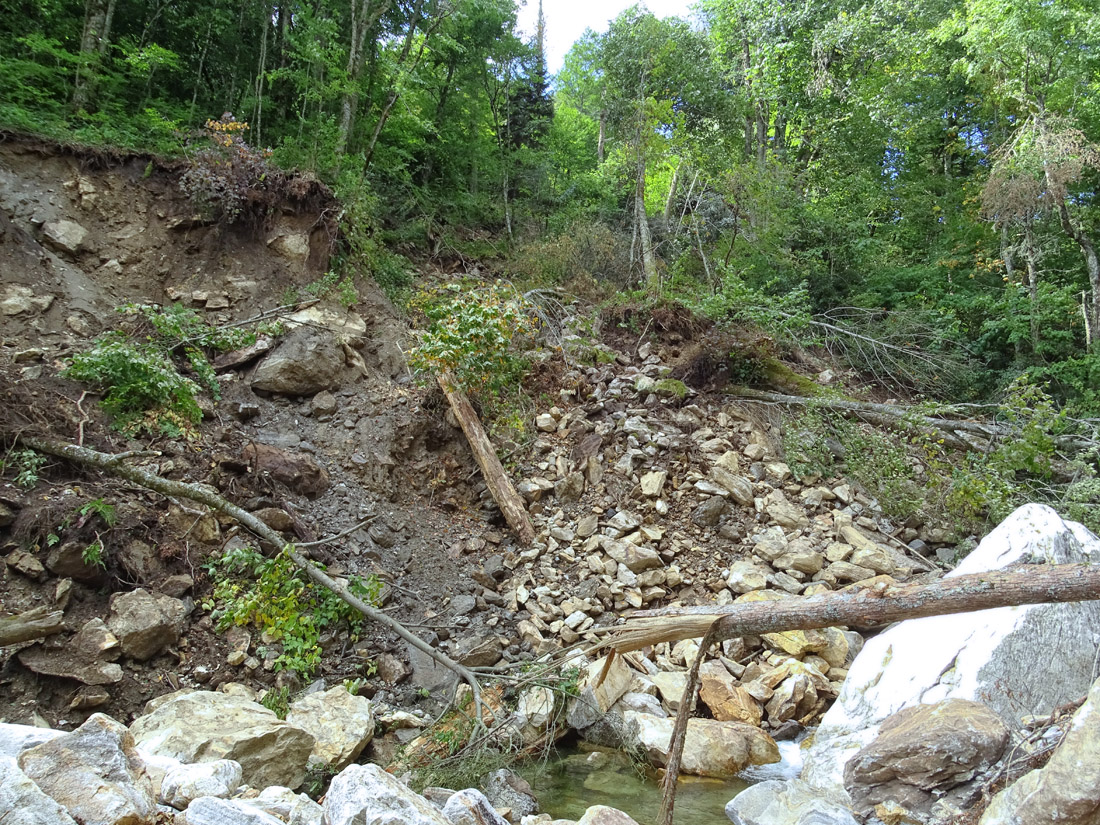
Base of 2nd debris flow on the south side of the prong. (9-9-21)
9-9-21
The above pictures shows the lateral view of the base of the 2nd debris flow. Close examination shows it was deposited on bedrock as about 2-3 feet of rock and dirt at its very bottom have been washed away revealing fresh bedrock. Washing away of only 2-3 feet at the base of the debris flow is further evidence that it occurred after the stream returned to a much lower than peak flash flood level.
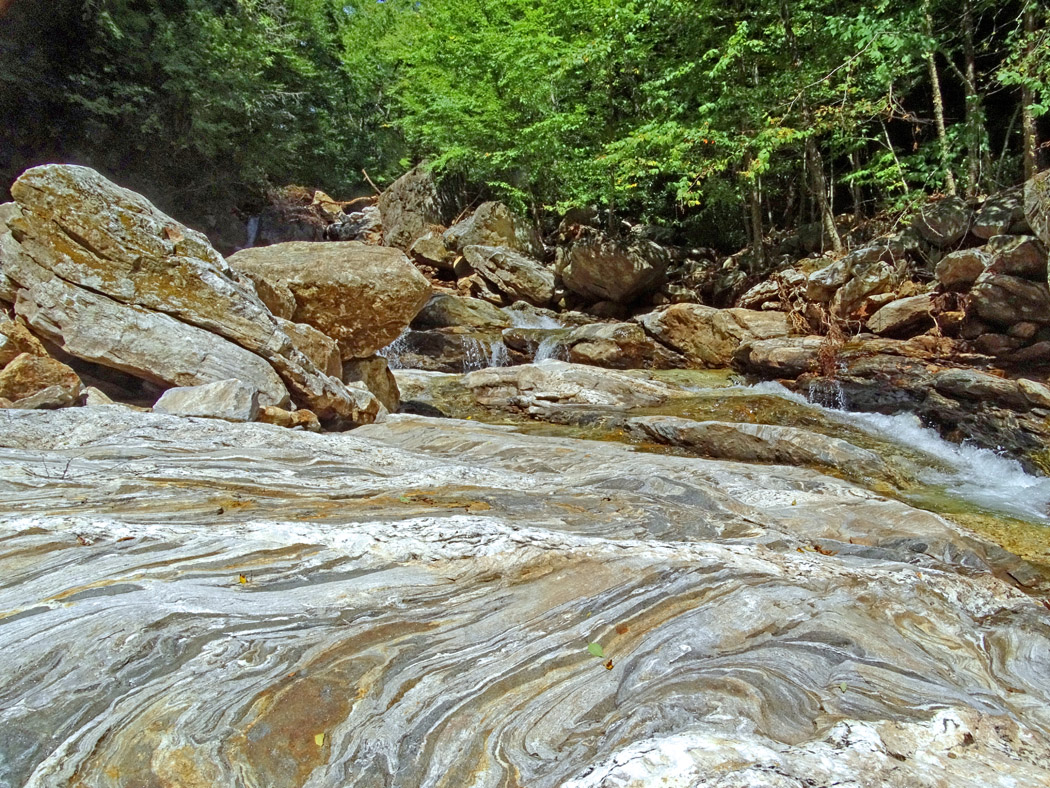
Migmatite bedrock in the streambed (9-9-21)
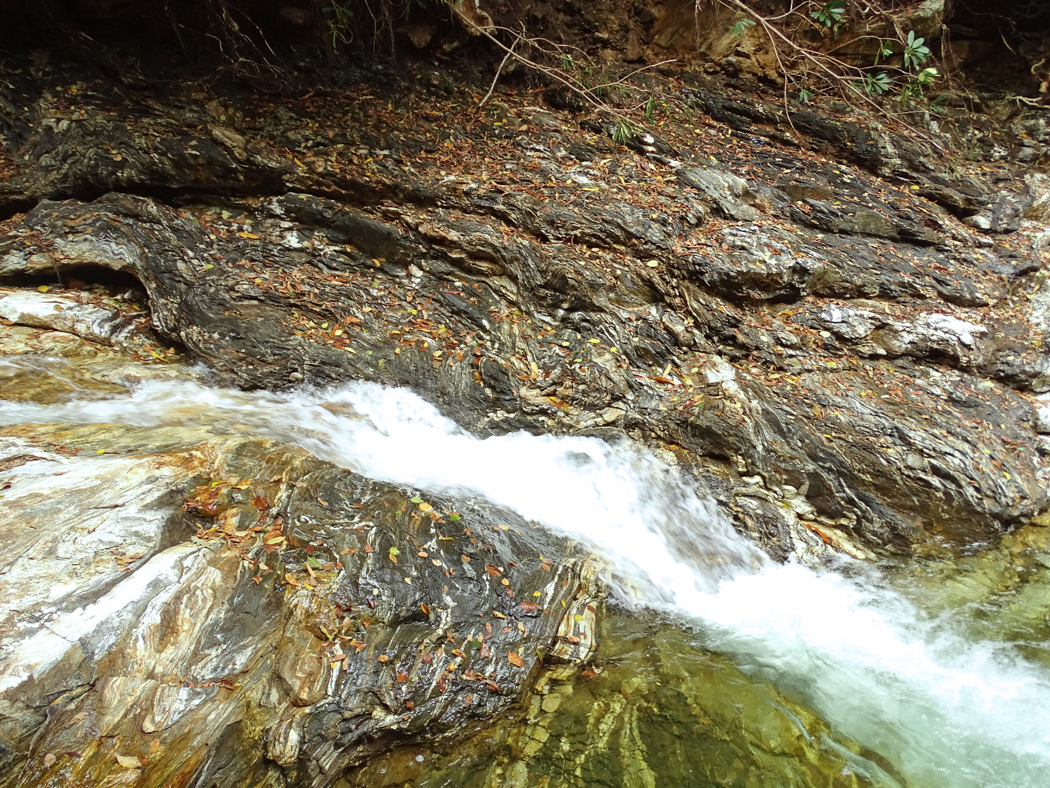
Highly folded mica schist in streambed. (9-29-21)
As can be seen along the prong in the above picture, the highly folded mica schists are far less resistant to weathering than the more competent migmatites. This may lead to differential weathering that enhances erosion where mica schist predominates, thus leading to areas more prone to landslides and debris flows.
Scattered boulders in the streambed. (9-9-21)
Cut bank of an ancient debris flow on the south side of the prong (9-29-21)
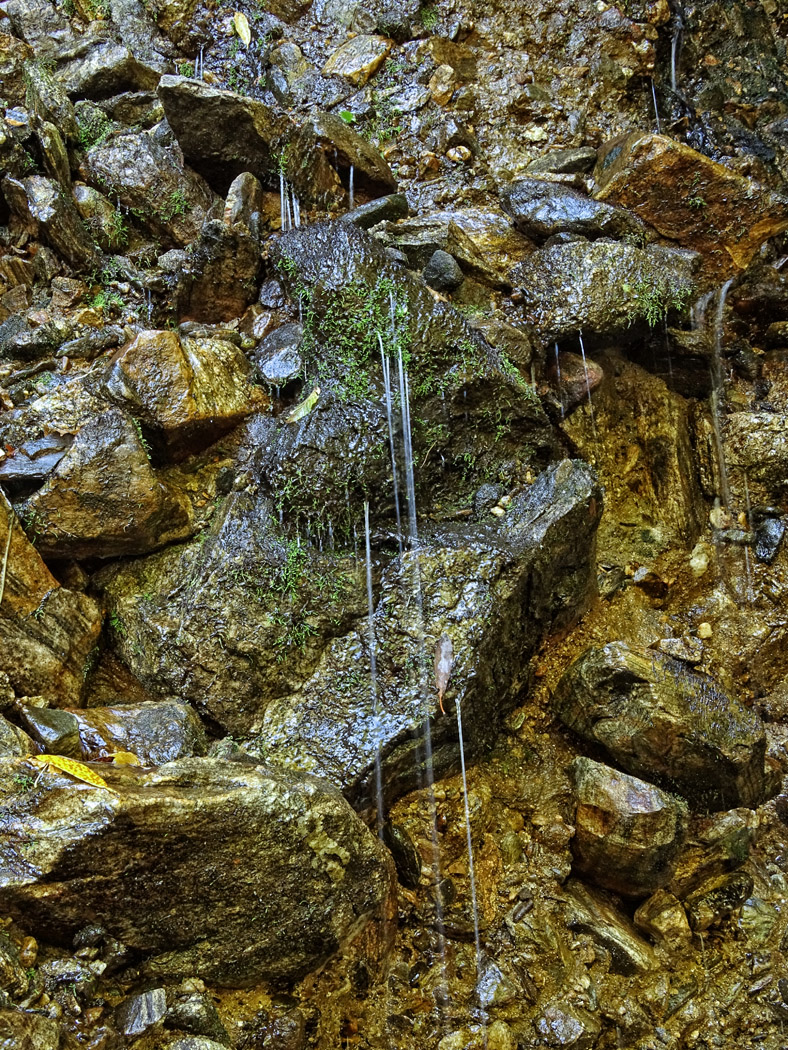
Cut bank of ancient saturated debris flow with springs on the south side of the prong (9-29-21)
9-29-21
The debris flow shown above is on the north side of the prong at about a 25-degree bend to the southeast; this after a relatively straight and long upstream section. It is presumed that this bend caused the flash flood to greatly erode and undermine the slope on the north side of the prong, thereby re-activating the debris flow.
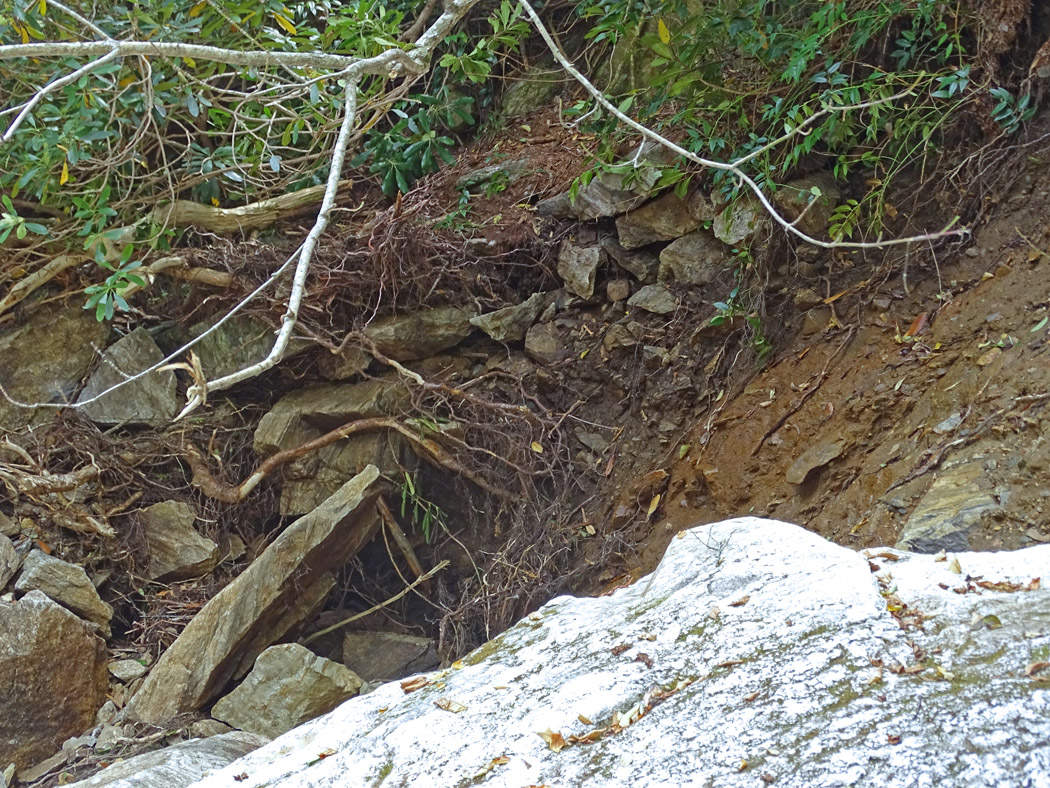
Cut bank and deep scour on south side of prong adjacent to bedrock in the streambed. (9-29-21)
Cut bank on north side of prong showing ancient debris flow intermixed with a river deposit(?) (9-29-21)
Undermined damaged tree on north side of prong (9-29-21)
Cut bank on north side of prong (9-29-21)
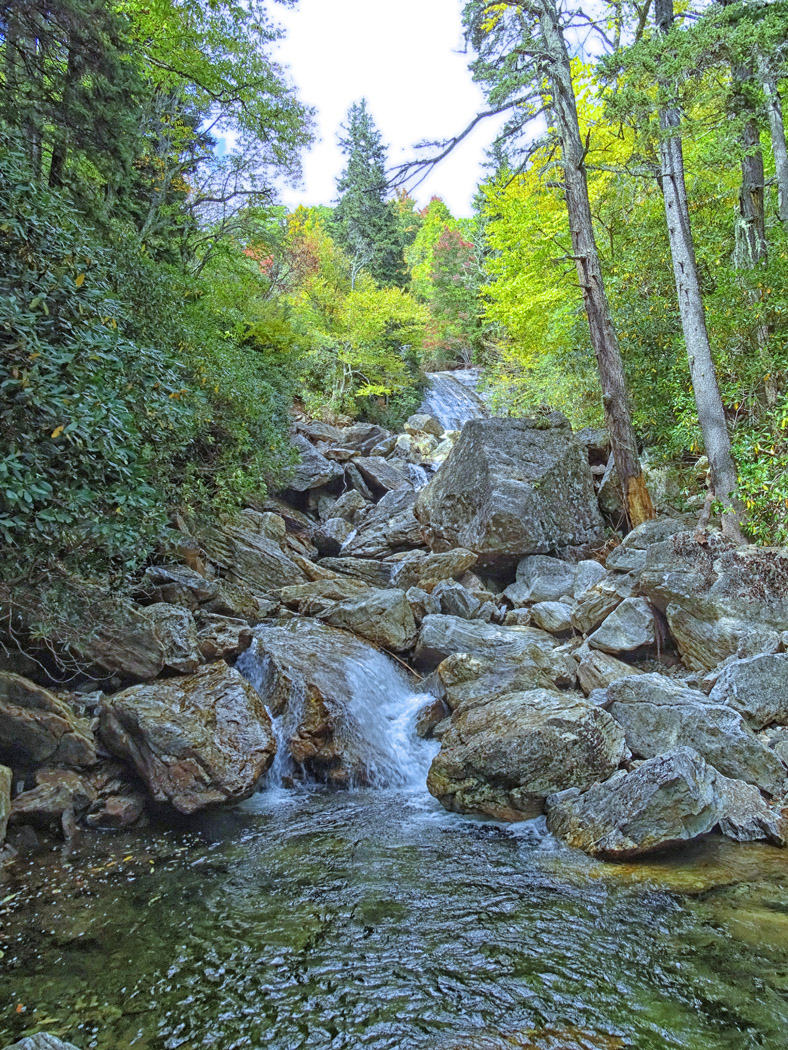
Yellowstone Falls (9-29-21)
Base of Yellowstone Falls (9-29-21)
9-29-21
As shown in the above picture, a landslide occurred on north side of Yellowstone Prong. The stream takes a pronounced near 40-degree bend to the southeast at the base of the falls. The high volume of water coming over the falls during the flash flood appears to have greatly undercut the north bank, but was diverted to the southeast by a wall of well-established boulders and large trees.
Translational landslide on south side of prong at base of Yellowstone Falls (9-29-21)
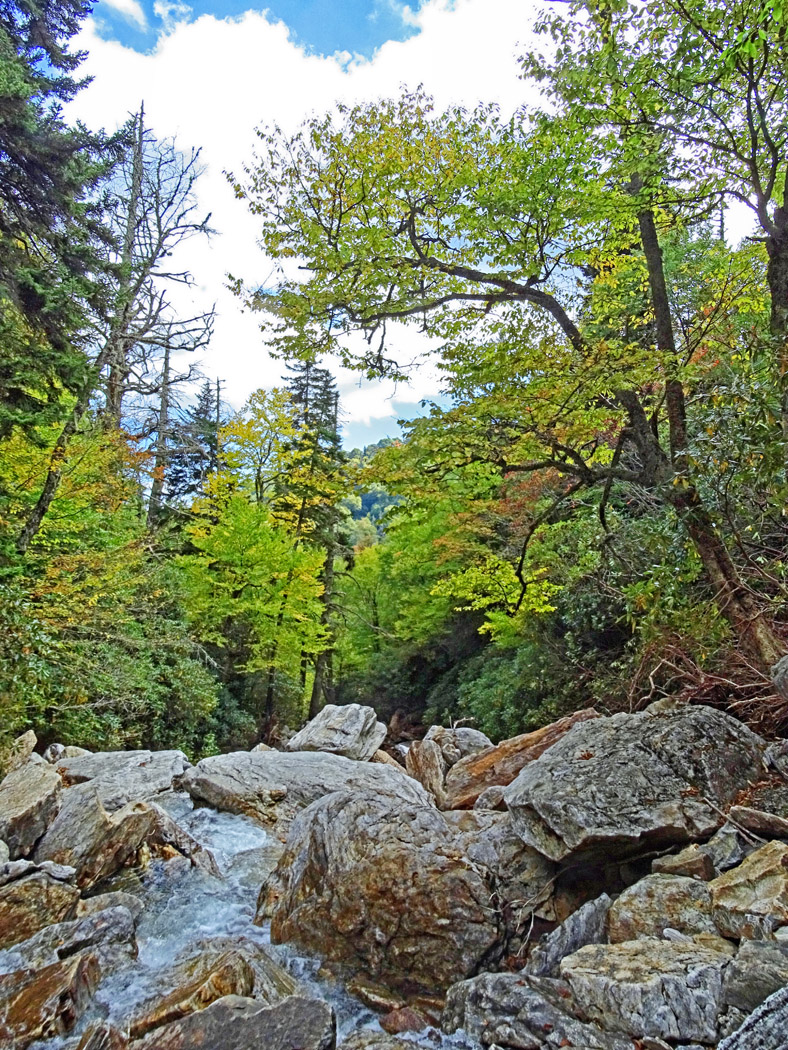
Eastward view from near base of Yellowstone Falls (9-29-21)
YELLOWSTONE PRONG FLASH FLOOD,
LANDSLIDES AND DEBRIS FLOWS
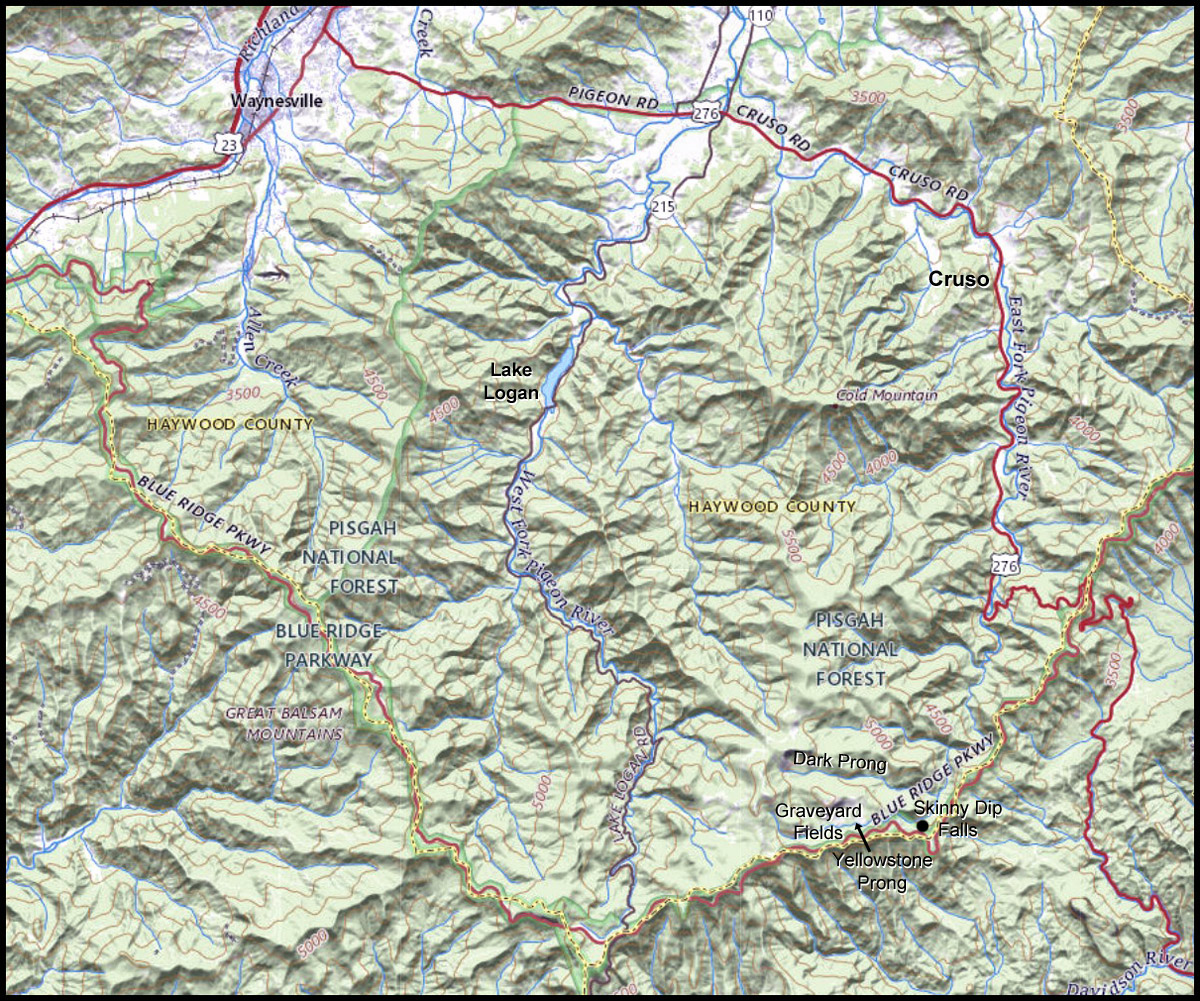
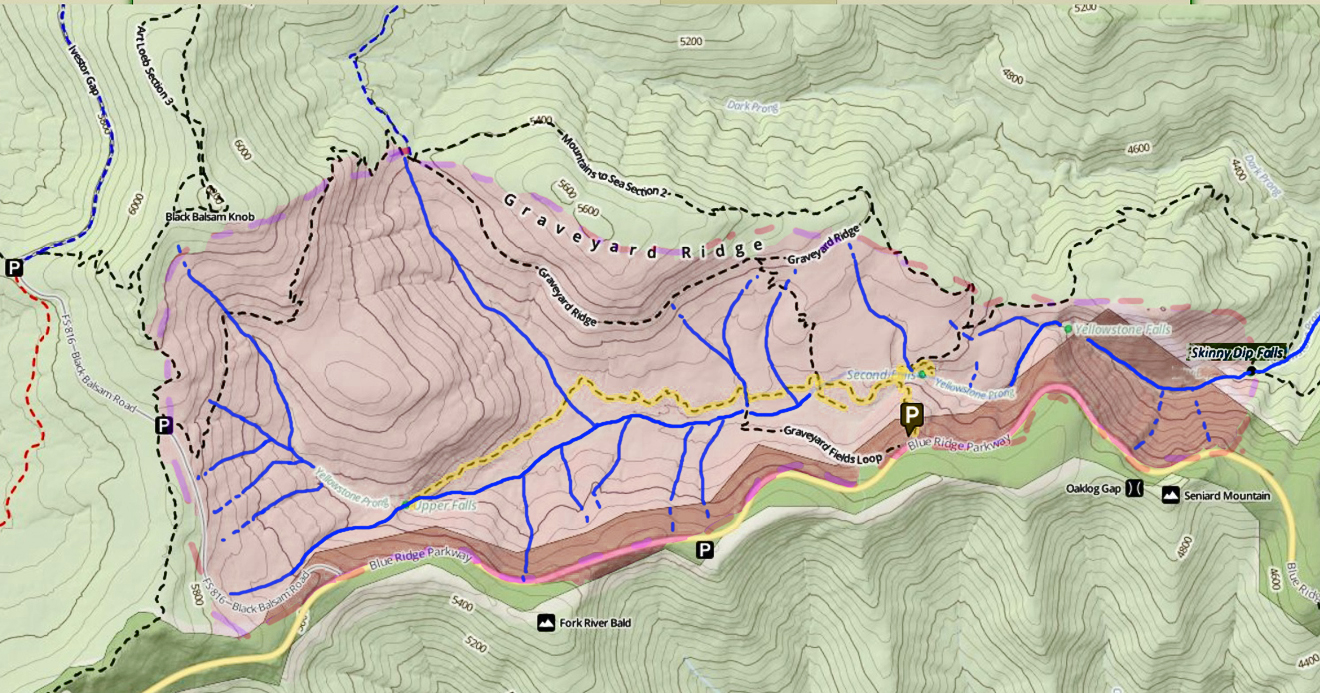
As can be seen in the following two maps, the Graveyard Fields high valley is the principle drainage area for Yellowstone Prong; meaning that runoff from excess rain within the Graveyard Fields area ends up in Yellowstone Prong.
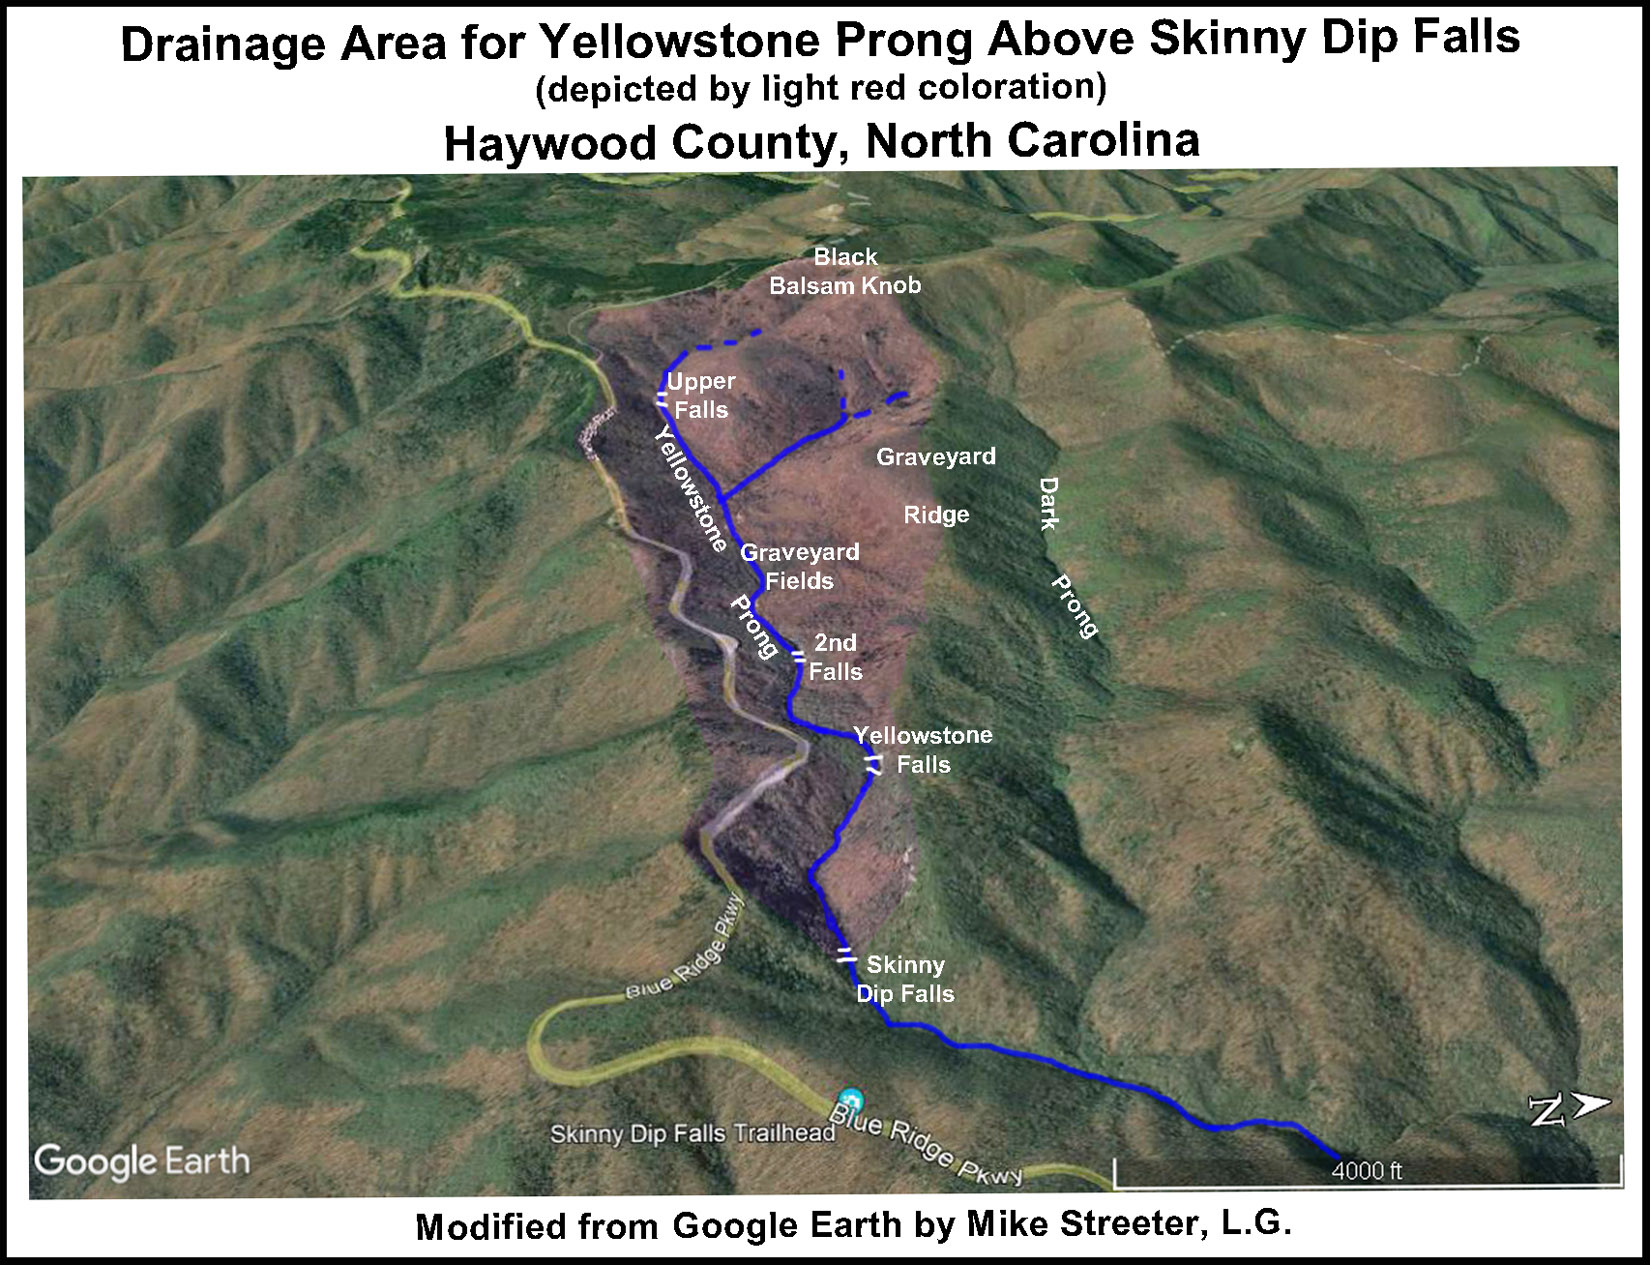
It is speculated that Graveyard Fields got its name from moss-covered tree stumps that dotted the barren landscape like gravestones after loggers clear-cut the spruce-fir forested area in the 1920s. But this speculation doesn't explain why the woodland hasn't returned to its natural state. What is known for certain is that a fire burned approximately 25,000 acres in an area that encompassed Graveyard Fields in 1925. Randall Burgess, a retired district ranger for Pisgah National Forest, explains that a spruce-fir forest has a layer of organic material on its floor. The 1925 fire burned through the duff layer down to mineral soil, depleting necessary nutrients for regrowth. The soil sterilization and another fire in April 1942 interrupted natural succession, perhaps leaving Graveyard Fields in a perpetual brush-shrub state. (Source: https://wncmagazine.com/feature/healing_nature).
As stated in the preface of this report, the two key elements for a flash flood are rainfall intensity and duration. Topography, soil conditions, and ground cover also play important roles. There is no question that Graveyard Fields was inundated with a great amount of excess rain leading up to and on August 17, 2021. What is also known is the topography, poor overall soil conditions and a lack of ground cover make Graveyard Fields prone to excess runoff during rain events, as demonstrated by previous pictures in this report. These factors resulted in a tremendous volume of water entering Yellowstone Prong on August 17, 2021. The half-mile between Yellowstone Falls and Skinny Dip Falls is a relatively narrow steep-sided canyon as compared to the much broader and larger Graveyard Fields area. This results in Yellowstone Prong being essentially funneled into a smaller space making it more susceptible to flash flooding with an extreme high-water level.
There can be no doubt a powerful flash flood occurred in Yellowstone Prong on August 17, 2021. While nobody I know was present to witness the event as it occurred, the carnage left in its wake is ample proof it happened. What may be questionable is the size and intensity of the flash flood and timing as related to the associated landslides and debris flows.
Based on observations, including the heights of stream-deposited trees and snags and damage to the base of trees, at key locations along the creek, I estimate the water level at the height of the flood averaged about 15 feet.
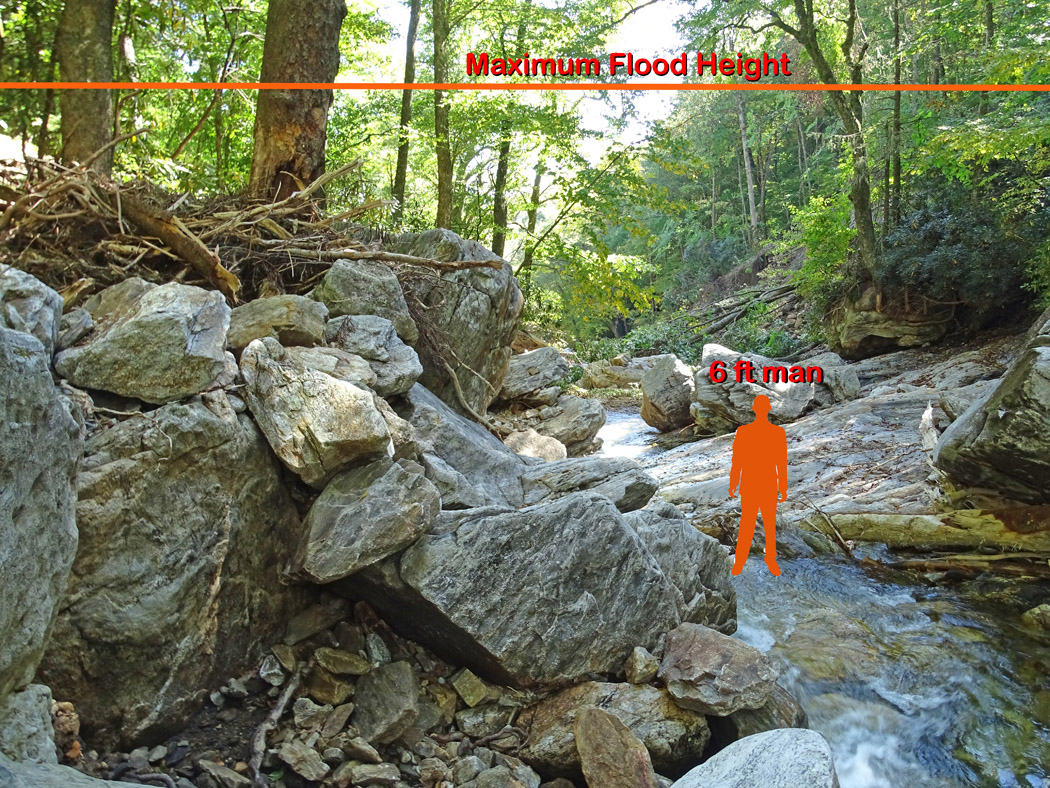
9-29-21
The maximum flood height estimate in the above picture is based primarily on my measurement of the 2-1/2 ft. diameter of the damaged tree and my height compared key boulders at this spot.
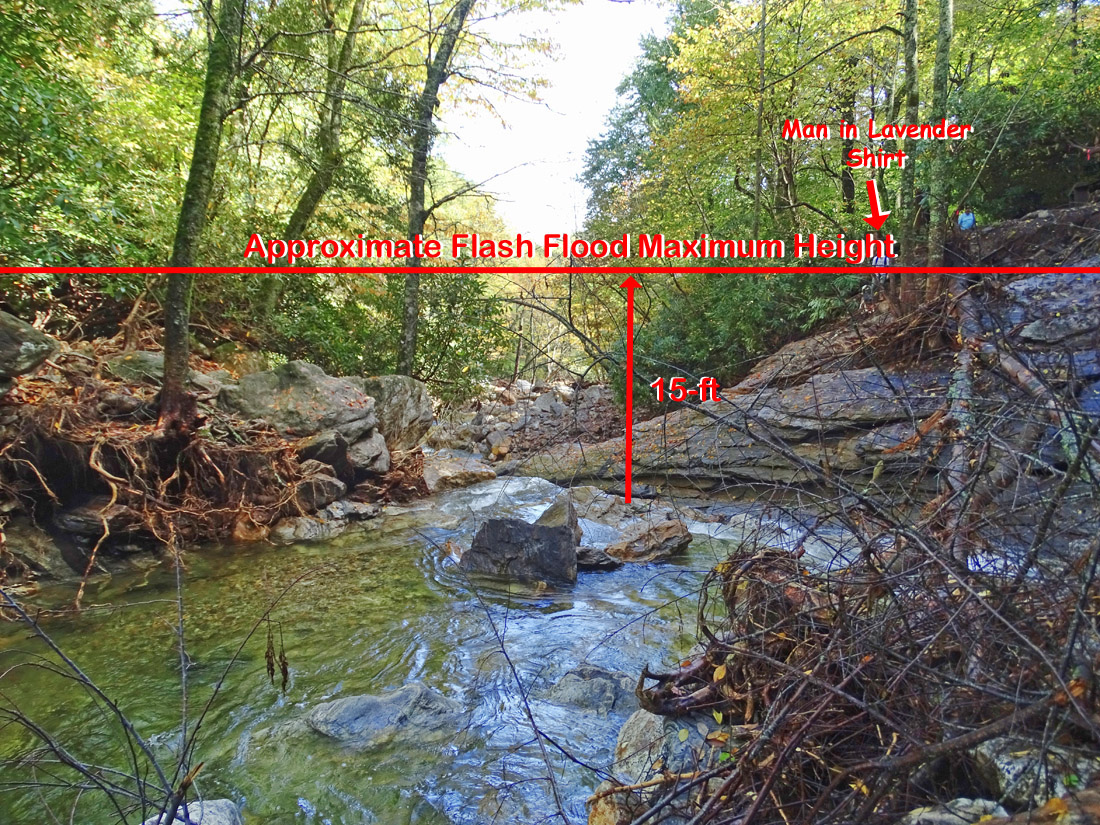
10-9-21
The maximum flood height was determined by scale based on an assumed height of 6-ft for the man in the lavender shirt in the above picture. This flood height is corroborated by GPS and Google Earth data, as shown in the following image.
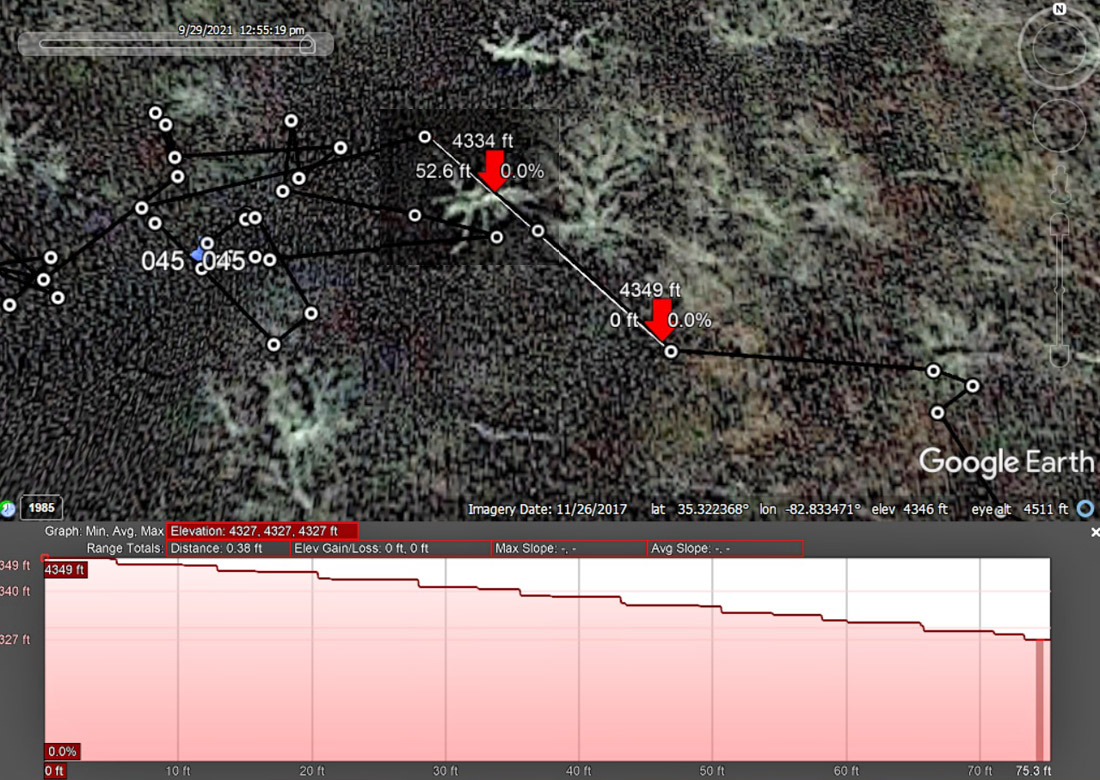
Although it is possible to estimate the height of the flash flood at its peak, determining the height of the initial flash flood wave is beyond my expertise. However, based on the similarities of the 1990 Ohio and 1992 Cherokee flash floods detailed in the preface to this report, the initial wave may have been at least 6 feet, but rose quickly to its maximum height of 15 feet in six hours if the rate mirrors that of the Cruso East Fork flash flood. USGS gauging records show the East Fork flash flood rose from its normal height to its peak of 16 feet in 6 hours and dropped to below flood stage (8.5 ft) at about the same rate it rose. But this is pure speculation since there are many unknowns, including the duration, intensity, and timing of rainfall at Yellowstone Prong and Graveyard Fields. The intensity of the flash flood could perhaps be determined by the size of boulders it moved. Boulders that weigh as much as 20 tons or more were moved unknown distances downstream, but these are complex calculations again outside my area of expertise. But in laymen's terms, the intensity and destructive force of the flash flood are mind-blowing.
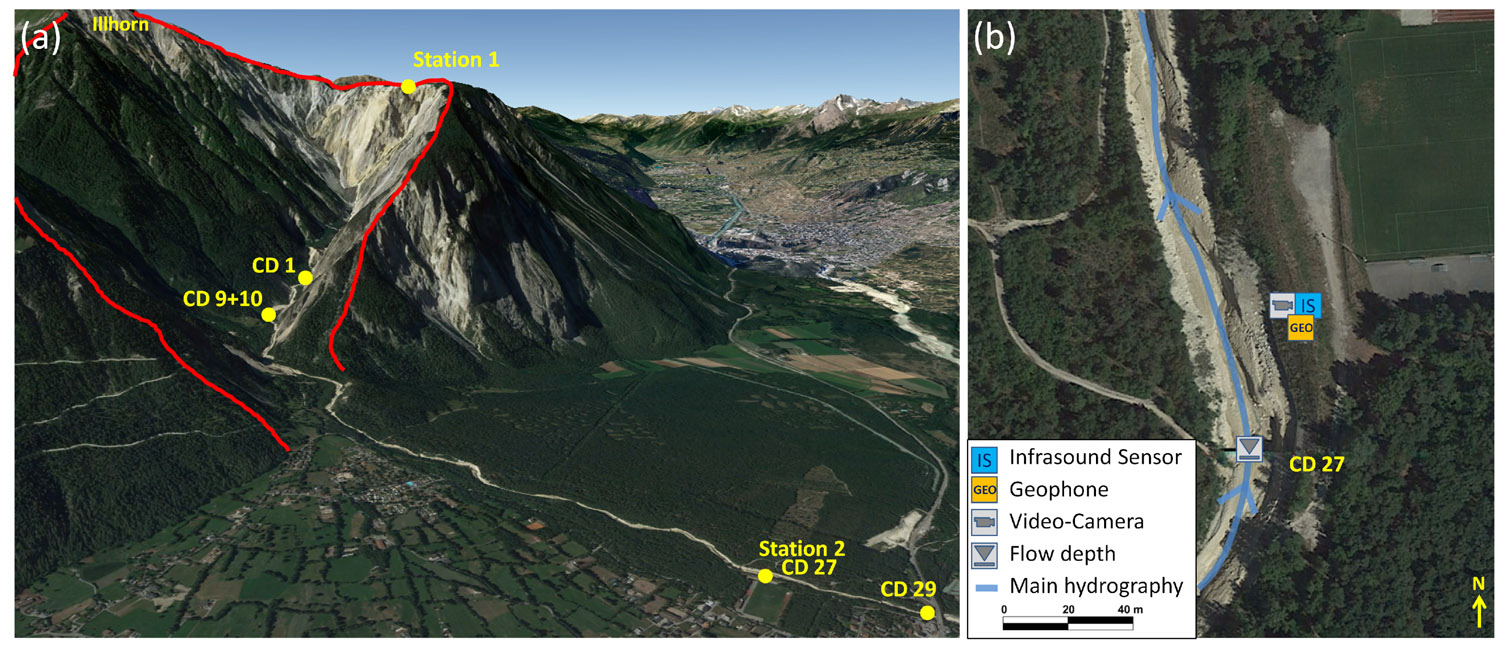
To demonstrate what the initial wave of the Yellowstone Prong flash flood may have looked like, I offer Illgraben. The Illgraben is a very active alpine catchment located near the village of Susten (Leuk), in Canton Valais, Switzerland. This catchment is particularly interesting because it generates many flash floods and debris flows, some of which are very large. Since 2000, the Swiss Federal Institute for Forest, Snow and Landscape Research has been using Illgraben as a monitoring site for debris flows. They have installed instrumentation in the catchment and in the debris flow channel. Cameras are also part of the set-up and several large debris flows have been recorded. They also built a warning system for the catchment to protect the local population. (from https://blogs.agu.org/landslideblog/2016/07/28/illgraben-debris-flow-video/)
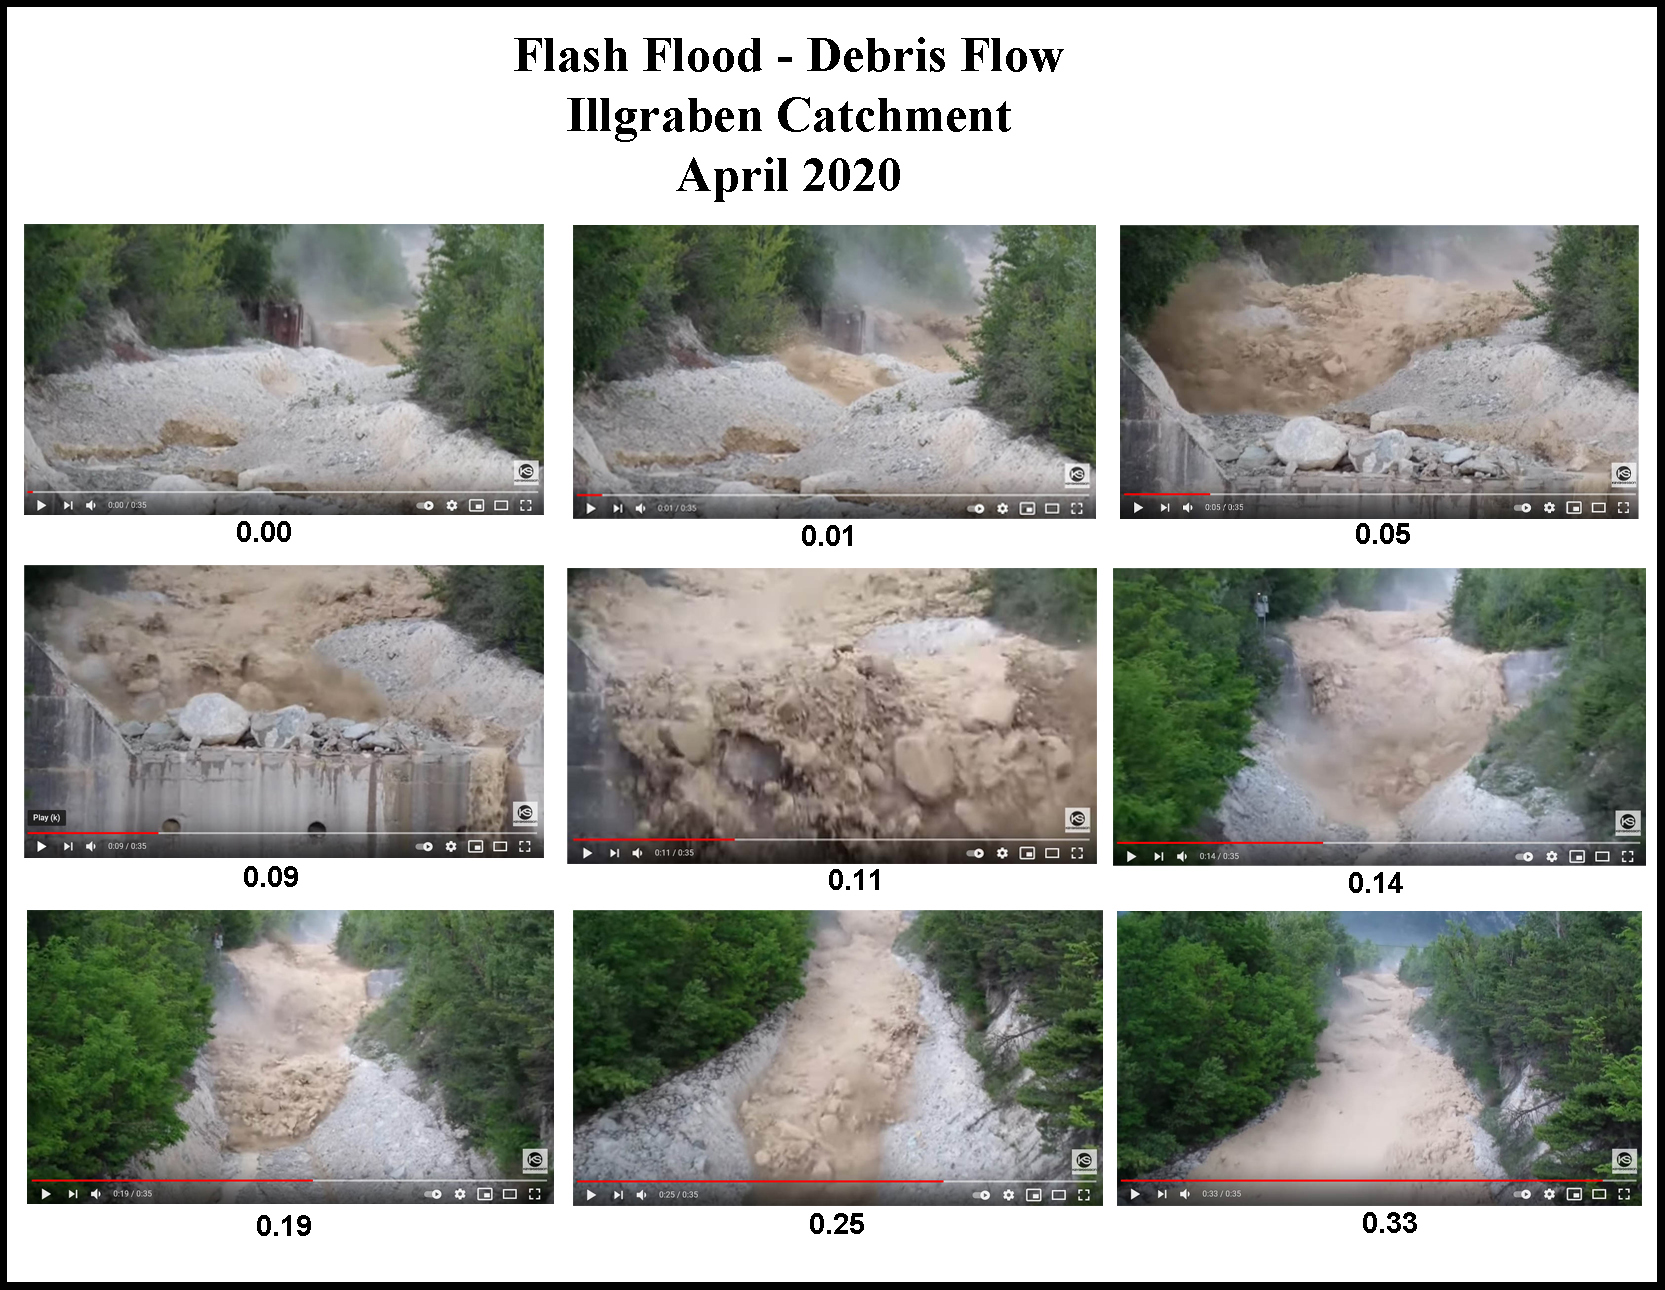
Click Here to View Illgraben, Switzerland Flash Flood/Debris Flow Video
(You may have to skip ads.)
Landslides are all too common in the western North Carolina mountains due to its unique geology and topography. The North Carolina Geological Survey (NCGS)and Appalachian Landslide Consultants, LLC (ALC) have created detailed landslide maps of the region. The following maps show the locations of known landslide deposits surrounding Yellowstone Prong in the vicinity of Skinny Dip Falls.
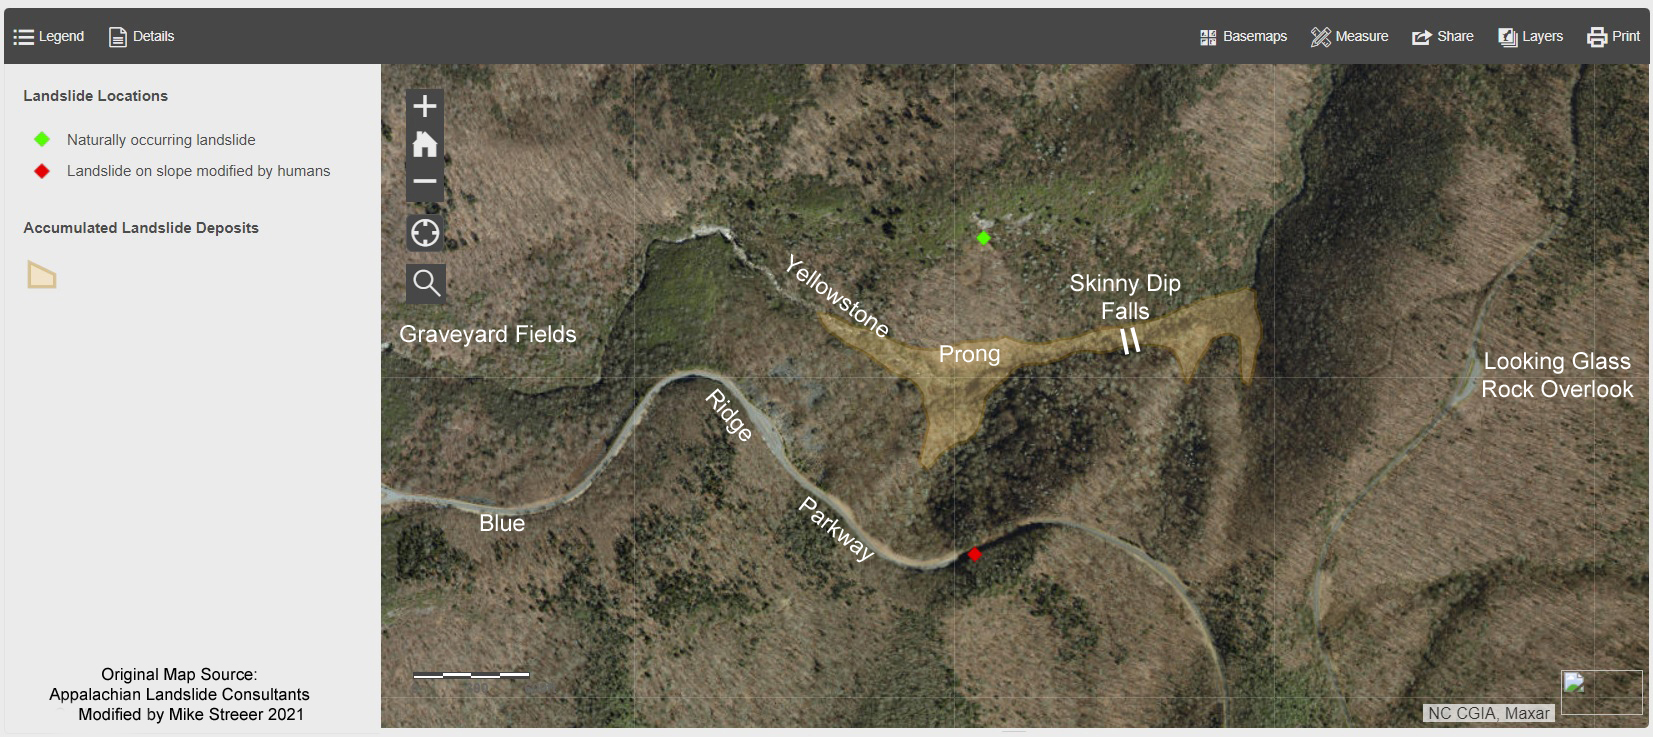
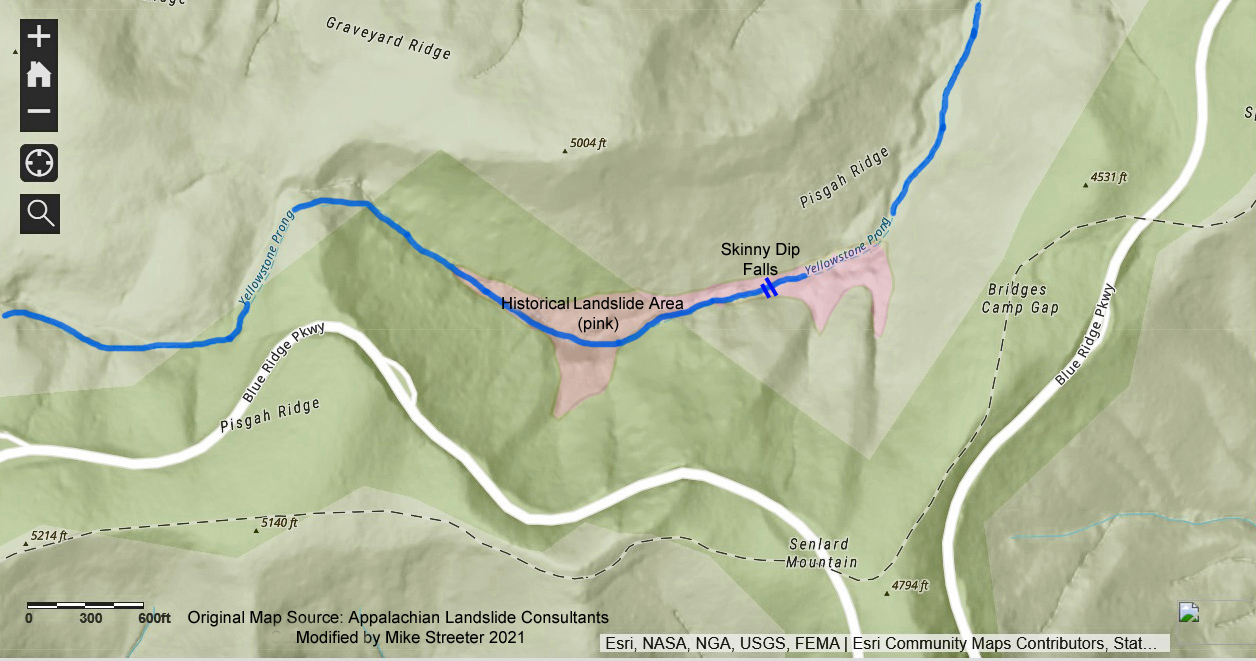
The following map shows the locations of the flash flood-associate landslides and debris flows shown in earlier pictures in this report.
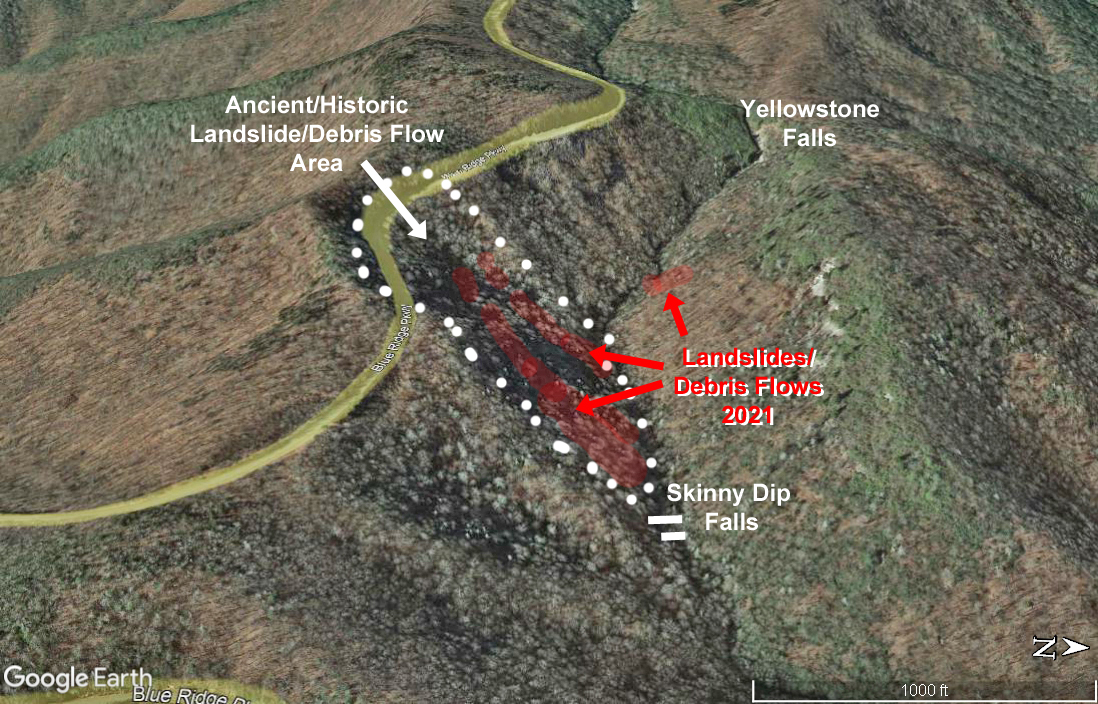
The landslide and debris flow locations match up with those identified and mapped by the NCGS and ALC. The intense rainfall on August 17th played a key role in reactivation of the landslides and debris flows, but oversaturated ground was only part of the story. Based on field observations as shown and explained earlier in this report, flash flood undercutting of the steep slopes surrounding Yellowstone Prong was instrumental in causing the landslides and debris flows. Cutting the legs out from beneath water-saturated unstable ground is a sure-fire recipe for collapse from above. The August 17th debris flows would have likely occurred without undercutting due to their oversaturation and inherent instability, but the extensive erosion at their bases may have played a role. Since the base of the debris flows do not appear to have been impacted by the flash flood, they likely took place after the flood waned and the stream level returned to its near normal level.
SUMMARY
Heavy intermittent rains soaked the western North Carolina mountains from August 15th through the 16th, 2021. On the morning of August 17, 2021, Tropical Storm Fred arrived from the South bringing with it torrential rain that would persist almost without pause for nearly 10 hours, beginning at around 8:00 am near Cruso, NC. A flash flood that originated in Graveyard Fields off the Blue Ridge Parkway tore through Yellowstone Prong below Yellowstone Falls with a force powerful enough to move and pile up huge multi-ton boulders and massive whole trees, smaller trees, branches and other debris into enormous rock piles and snags. The area surrounding popular Skinny Dip Falls was completely rearranged to nearly unrecognizable by the flood. The Yellowstone Prong flash flood reached about 15 feet at its peak and led to landslides. The flash flood was also likely instrumental in reactivating ancient debris flows on the steep slopes surrounding Yellowstone Prong. A flash flood also occurred along the East Fork of the Pigeon River, the downstream equivalent of Yellowstone Prong, beginning at around noon and peaking to about 7.5 feet above flood stage at 6:00 pm. The Cruso flash flood and associated landslides and debris flows caused devastating property damage and loss of life.
EPILOGUE
STORMS HAVE NOT BECOME MORE FREQUENT OR INTENSE
Well before Hurricane Ida struck the United States in late-summer 2021, countless so-called climate scientists and mainstream media outlets pronounced with an air of unquestionable certainty that hurricanes and other adverse weather events have gotten more frequent and intense over recent decades; this they say is no doubt due to climate change (formerly known as global warming). But their contention is clearly driven more by alarmism and activism than actual data.
A recent study has determined the recent uptick in named Hurricanes can be explained by a number of factors unrelated to global warming, including observation bias. (Changes in Atlantic major hurricane frequency since the late 19th century", by Gabriel Vecci of Princeton, Christopher Landsea of NOAA, Wei Zhang of Utah State, Gabriele Villarini of the University of Iowa; and Thomas Knutsen of NOAA}.
According to the study's authors, "Due to changes in observing practices, severe inhomogeneities exist in this database, complicating the assessment of long-term changes. In particular, there has been a substantial increase in monitoring capacity over the past 170 years, so that the probability that a HU [Atlantic Hurricane] is observed is substantially higher in the present than early in the record."
In other words, more storms could be seen after the advent of satellites in the late 1960s than in the past. Therefore, pre-satellite storms are underrepresented in historical data. The Vecci et al. study goes all the way back to 1851 and is supported by eyewitness accounts all along the eastern seaboard of the U.S., the Gulf of Mexico, islands in the Atlantic Ocean, and fishermen who ventured out to sea. The authors worked off of the accounts and, after adjusting, came up with the following chart:
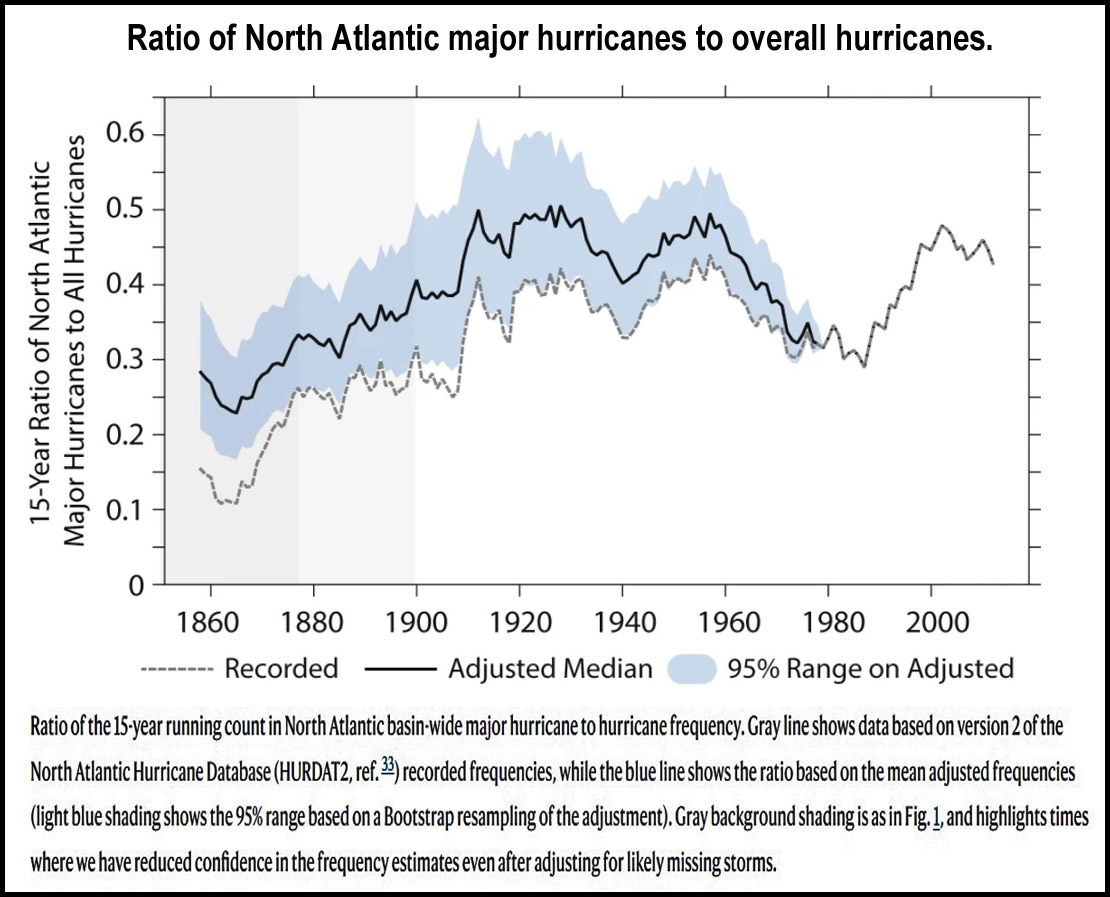
The researchers were able to find no evidence of a larger-than-usual number of hurricanes in recent decades when compared to the old-school data.
"The homogenized basin-wide HU and MH [Major Hurricane] record does not show strong evidence of a century-scale increase in either MH frequency or MH/HU ratio associated with the century-scale, greenhouse-gas-induced warming of the planet."
The results showed the increase in hurricanes in current decades is similar to previous spikes in hurricane activity in the early 1880s and late 1940s. They also found no evidence that the storms of today are more intense than historical storms. The researchers also conclude that the recent increase in storms is not a new record number of hurricanes but, rather, a rebound from a low number of hurricanes in the late 20th century.
"This homogenized record indicates that the increase in NA [North Atlantic] HU and MH frequency since the 1970s is not a continuation of century-scale change, but a rebound from a deep minimum in the late 20th century."
The naming of hurricanes began in 1953. So, when climate alarmists bray about a "record number of named storms," they fail to account for the significant number of pre-1953 unnamed storms or those that never made landfall and thus were not recorded prior to the satellite era. Presentation is everything to climate alarmists, but their fearmongering loses is effectiveness when they can't scare anyone into believing that never-before-seen horrors caused by global warming are taking place and will only get worse.
What does NOAA have to say about the historical frequency of hurricanes? There are wild fluctuations year to year. But especially bad storms over the past few years came after years of lower than normal hurricane activity, both in the Atlantic and Pacific. NOAA data show the annual Accumulated Cyclone Energy (ACE) in the North Atlantic going back to 1950.
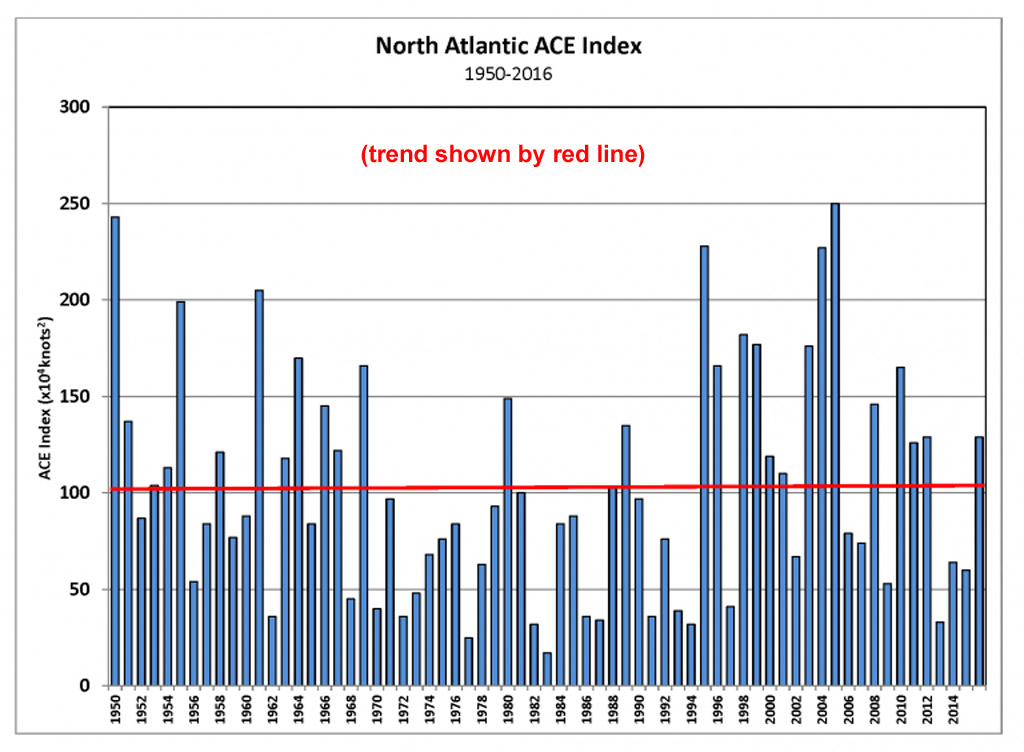
As NOAA explains "The ACE index is used to calculate the intensity of the hurricane season and is a function of the wind speed and duration of each tropical cyclone." There is no discernible upward or downward trend in this index since 1950.
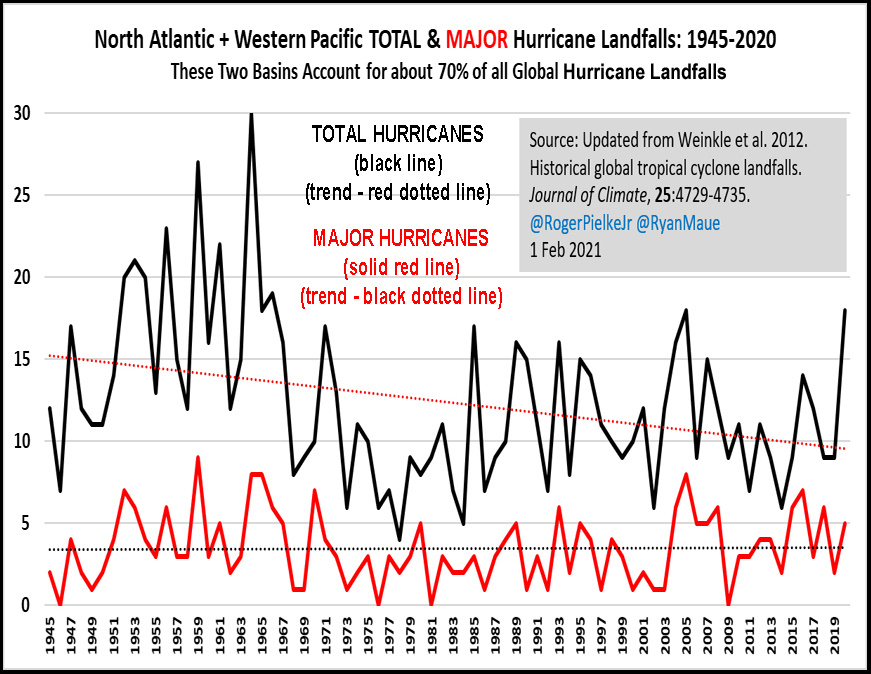
Another study performed by Weinkle et al. 2012, and updated in 2020 by others, shows the frequency of total North Atlantic and Western Pacific hurricanes has decreased since 1945 and there is no upward or downward trend in the number of major hurricanes.
A web search about adverse weather events in recent history will bring up a plethora of articles in which the authors erroneously attribute climate change as the reason for an increase in frequency and intensity of storms. If you believe this, I've got some oceanfront property in Arizona you may be interested in buying for a song.
CLICK THE LITTLE MINER TO RETURN TO THE McOCKS.COM FIELD TRIP INDEX PAGE 
|